Download
1 / 11
110 likes | 259 Views
This document outlines the regional TAZ (Traffic Analysis Zone) forecast allocation process, detailing methods for estimating job and housing demand, land supply, and travel demand. Key phases include reviewing capacity assumptions with local governments, releasing beta forecasts, and conducting research on market segmentation and redevelopment. Insights on travel networks and economic factors influencing housing choices are integrated. Emphasis is placed on the timeline for forecasting updates and collaboration with planning directors to ensure accuracy and responsiveness in planning.

E N D
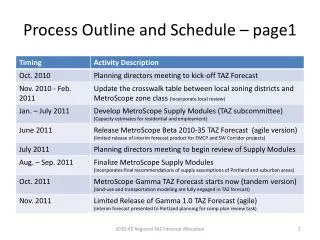
Process Outline and Schedule – page1 2010-45 Regional TAZ Forecast Allocation
Process Outline and Schedule – page2 2010-45 Regional TAZ Forecast Allocation
UGR/Growth Distribution – Two Step Process 2010-45 Regional TAZ Forecast Allocation
HIA Demand Forecast Travel Times/Access (Travel Demand Model) Job Demand Forecast HIA location choices Job location choices Job Location Choices MetroScope Residential Model MetroScope Non-Residential Model HIA Location Choices Land Supply / Capacity Data Vacant Land, Refill Supply, UR etc. MetroScope Model Schematic Demand Output Supply 2010-45 Regional TAZ Forecast Allocation
Supply Data: MetroScope Capacity Concepts 2010-45 Regional TAZ Forecast Allocation
Supply Data: Residential Capacity (PMSA) 2010-45 Regional TAZ Forecast Allocation
Supply Data: Capacity by Type (UGB) 2010-45 Regional TAZ Forecast Allocation
Travel Demand Data: Travel Networks Networks in TAZ GAMMA Forecast 2010 existing 2017 network 2035 RTP Federal (Constrained) 2035 RTP State (Strategic) 2010-45 Regional TAZ Forecast Allocation
Recap and Next Steps • Progress to date • Limited release of a Beta TAZ forecast • July 22: planning directors meeting to review capacity assumptions • Nov: final confirmation of capacity assumptions with each local government staff • Limited release of a revised Beta TAZ forecast • Release midterm Gamma TAZ forecast (2010 to 2025) for local inspection • Concerns (next slide) • Research agenda to address concerns 2010-45 Regional TAZ Forecast Allocation
Gamma 1.0 TAZ Forecast: Preliminary Forecast Key Concerns - Forecast Inputs and Assumptions: • Single family housing supply • Equity and price effects (economic dislocations) • Redevelopment (economic thresholds) • Redevelopment of relatively new development • Mixed use residential (horizontal districts) anticipated development vs. assumed capacity • Mixed use residential density assumptions (MUR 9-10) • Market differentiation by household type, tenure and location 2010-45 Regional TAZ Forecast Allocation
Research Agenda • Proposed improvements to the forecast distribution process:* • Residential choice study enhanced with market segmentation • Redevelopment supply assumption refinement • Review actual development densities in high density multifamily and mixed use residential zone classes *depending on funding availability 2010-45 Regional TAZ Forecast Allocation