Download
1 / 6
60 likes | 244 Views
Measures of Spread. The measures of central tendency can tell us about central values of data, however we also want to know how the data clusters around these centres.

E N D
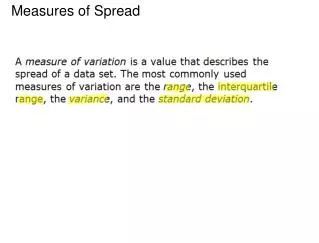
The measures of central tendency can tell us about central values of data, however we also want to know how the data clusters around these centres. Measures of spread (dispersion) – quantities that indicate how closely the data clusters around the center. There are different measures of spread. Standard Deviation and variance Population s.d. = Sample s.d. =
A deviation is the difference between an individual value in a set of data and the mean for the data. The larger the size of the deviations, the greater the spread of data. Variance is the square of the standard deviation How much variability there is in the data. If we are working with grouped data, we have to use data points using a midpoint of the intervals – similar to the mean of intervals
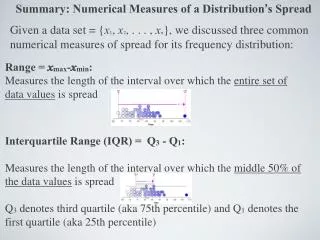
Quartiles divide the set of ordered data into four groups with equal numbers of values; similar to a median that divides the data into two equal groups. There are three dividing lines in order to get quartiles. Q2 is known as the median. Q1 and Q3 are the medians of the upper and lower halves of the data.
Interquartile range the range of the middle half of the data (does not necessarily fall in the middle of the spectrum). The larger the range, the greater the spread of the central half of the data. This provides a good measure of spread. Semi interquartile range is ½ of the interquartile range. This tells us how closely the data clusters around the median. Box and wisker plot a way to illustrate the above mentioned.
Homework Pg 148 # 1,2,3,4,7,8,10,11,14