Download
1 / 17
190 likes | 335 Views
Measures of Centre and Spread. Sections 2.5 and 2.6. Population vs. Sample. A population refers to an entire group that is being studied. A sample is a selection of people or things from that group. Eg) We survey students in our classroom to determine the opinion of students at NACI

E N D
Measures of Centre and Spread Sections 2.5 and 2.6
Population vs. Sample • A population refers to an entire group that is being studied. A sample is a selection of people or things from that group. Eg) We survey students in our classroom to determine the opinion of students at NACI Eg) We take our top 5 marks to represent all of our marks
Measures of Central Tendency • You have decided on your top 5 marks to submit for your post-secondary applications. Your marks are 70, 70, 81, 83, 90 What best describes this data, Mean, median or mode?
Mean (arithmetic mean), sometimes referred to as the average Population Mean Sample Mean 70, 70, 81, 83, 90
Median The middle most number when numbers are arranged from lowest to highest: 70, 70, 81, 83, 90
Mode The most common number. 70, 70, 81, 83, 90 Note: There can be multiple modes, and there can also be no mode.
So why do we have three? Which is the best measure? Example 1) Suppose a class has the following marks on a test: 43, 43, 48, 49, 100
Or this….. • Example 2) A class has the following marks on their tests: 30, 30, 31, 80, 83, 88, 90
Or even this… • Example 3) A class has the following marks on their tests: 30, 30, 35, 95, 96
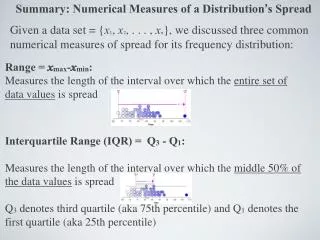
Measures of Spread • Suppose two students are applying for a position at a university, and they submit all of their marks. What is different about their marks? • Applicant 1: 71, 73, 75, 75, 77, 79 • Applicant 2: 50, 62.5, 75, 75, 87.5, 100
Variance: A Measure of Spread / Consistency • Population Variance is calculated as: Applicant 1: 71, 73, 75, 75, 77, 79 Applicant 2: 50, 62.5, 75, 75, 87.5, 100
Standard Deviation • Population Standard Deviation is Calculated as follows: Applicant 1: 71, 73, 75, 75, 77, 79 Applicant 2: 50, 62.5, 75, 75, 87.5, 100
Sample Deviation and Sample Variance • When we take a sample, the spread of the data is usually underestimated. To adjust for this, we simply change the formula for deviation and variance: Standard Deviation of a Sample Variance of a Sample
Practice: Pg. 127 Read Example 1 Pg. 133 1, 2, 3, 4, 9, 16 Pg. 138 1, 6a
Write a response to yourself: • Why do we have different measures of centre? • What do variance and standard deviation tell us?