Download
1 / 16
160 likes | 291 Views
Warm-up 2.3 Measures of Center and Spread. Sketch out a graph that would be the data if you collected pennies from everyone in the class and recorded the age of pennies in a dot plot. For example: A penny from 2014 is 0. A penny from 1994 is 20.

E N D
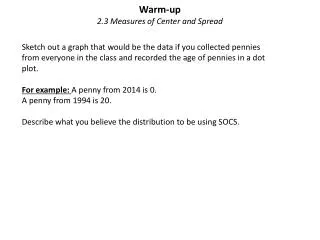
Warm-up2.3 Measures of Center and Spread Sketch out a graph that would be the data if you collected pennies from everyone in the class and recorded the age of pennies in a dot plot. For example: A penny from 2014 is 0. A penny from 1994 is 20. Describe what you believe the distribution to be using SOCS.
2.3 Measures of Center and Spread This bar chart shows a distribution of the number of children in a sample of 1000 randomly selected families in the United States. Make the necessary changes to convert it to a relative frequency bar chart
Standard Deviations and Frequency Mean: Mean w/ Frequency: Standard Deviation: Standard Deviation with Frequency: Change in your pocket. Average amount each coin is worth.
Recentering vs. Rescaling • Follow the directions step-by-step for rescentering and rescaling. • When you are done we will discuss the main points.
Recentering and Rescaling Discovery Sheet • Recentering and rescaling data are important ideas in A.P. Statistics. • You should know how adding n to each of the numbers in a data set affects the mean and measures of spread. How did adding 2 to the data set affect the mean and standard deviation? • You should know how multiplying each of the numbers by n affects the mean and measures of spread. How did multiplying the data set by 2 affect the mean and standard deviation? H.W. 2.3 pg 63 D #16 answer all parts; E #29 - 33
Common Quiz Mistakes • When making a graph, every axis gets a label. In addition, the entire graph needs a title. Units have to be included in the x-axis label. • When describing the steps for a simulation. Describe the process with Model, Repetition, Distribution and Conclusion in the context of the problem( count how many times the average blood pressure average is at or over 167.5 out of the total # of trials to determine if there is discrimination. • Don’t give calculator steps. On the AP exam you get points deducted if describing calculator steps.
Homework Answers2.1 and 2.2 Reviewsheet #1 and 2 • 1. Original Data - The statistics for this quiz were: mean = 30, • median = 32, IQR = 8, standard deviation = 6, minimum = 12, first quartile = 27. • If 10 were added to each score, the mean = 40; median = 42, the IQR and standard deviation would stay the same. The minimum would be 22 and the first quartile would be 37. • Basically all the summary statistics would go up by 10, except for the IQR and standard deviation.Adding 10 means you are recentering the data. It is only being shifted right 10 units. This does not affect the spread, which is measured by standard deviation. • b. If all the scores are doubled, all the statistics would be doubled. The mean would be 60, the median would 64, the IQR would 16, standard deviation would be 12, etc. • By multiplying by two, the data is being rescaled. Doubling changes and the summary statistics, including spread which is measured by IQR and standard deviation. • c. By multiplying by 2 and adding 20, this is rescaling and centering. All the summary statistics, except IQR and standard deviation, would by multiplied by 2 and then have 20 added to them. IQR and standard deviation would only be affected by the rescaling. So both of those values will be twice as much.
H.W. Answers continued… 2. a. This can be true if 25% of the largest classrooms have 40 students. b. Considering the smallest class, has 17 students. I would not consider 20 students to be a classroom that is unusually small. It is not considered an outlier using the outlier formula. Also 20 students is within 2 standard deviations of the mean. This also proves it is not extremely different from the average. c. Using the formula a class size of 33 would have a budget of $36.75. The IQR would be 0.75 (11) = $8.25
Homework Answers continued… Ages of husbands and wives when filing for marriage license. 3. Husband and wives registered ages. Age of husband Age of wife Both sets of ages are skewed right. The ages for husbands do not contain any outliers. The ages of the wives has an outlier with the 73 year old. Wives data has a greater range with a range of 57 versus the husbands with a range of 52. The median husband age is higher at 35.7 than the median age of wife at 29 years of age.