Download
1 / 14
340 likes | 979 Views
Measures of Spread. A measure of spread tells us how much a data sample is spread out or scattered. Range. Range is a measure of spread Range = highest score – lowest score A small range usually means a more consistent set of scores, except when there are a few extreme values. Range.

E N D
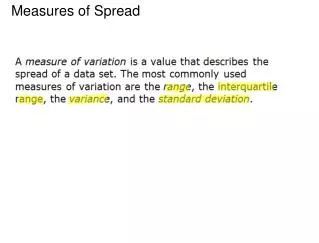
Measures of Spread A measure of spread tells us how much a data sample is spread out or scattered.
Range Range is a measure of spread Range = highest score – lowest score A small range usually means a more consistent set of scores, except when there are a few extreme values.
Range Range from grouped data = Highest score in highest class – lowest score in lowest class
Range Example: Wages of workers at two businesses A:$240, $240, $240, $245, $250, $250, $260,$800 B: $180, $200, $240, $290, $350, $400, $500,$600 Range A= 800-240 = 560 Range B= 600-180 = 420 Range of A is greater than B, but B’s scores are more spread. We need another way of measuring the spread of data.
Interquartile Range The interquartile range is the difference between the upper quartile (Q ₃) and lower quartile (Q₁) scores Finding the interquartile range can be complicated, so we use our calculators
Interquartile Range On your calculator • Enter data • Calculate stats • Arrow down, find Q3 value and subtract from Q1 value
Interquartile Range Example: 2 3 4 4 5 6 6 7 8 9 10 10 10 11 12
Five Number Summary A five number summary includes: {lowest score, lower quartile, median, upper quartile, highest score}
Five Number Summary On the calculator: • Enter the data into a list • Get the stat’s STAT (C CALC) ENTER (1 1_STATS) ENTER ENTER Scroll down to xmin, Q1, Med, Q3 and xmax
Standard Deviation Standard deviation is a measure of spread, it tells us how much a typical score in a set of data differs from the mean.
Standard Deviation • If the whole population is surveyed: • If only a sample is surveyed:
Standard Deviation Example: Find the standard deviation if this represents the population
Standard Deviation On the calculator: • Enter the data into a list • Get the stat’s Scroll down to either sx for the standard deviation of a sample Or σx for standard deviation of a population
Standard Deviation Example: Two brands of light bulbs are tested to see how long they burn (in hours) Brand X: 850 950 1400 875 1200 150 850 825 1000 900 Brand Y: 975 1100 1050 1000 975 950 1075 1025 950 900 • Which is more reliable (consistent)?