Download
1 / 8
80 likes | 164 Views
A comparison of student performance at different education levels between Washington and the US, showcasing gains and losses in math and reading over one to two years. Data from various locales is analyzed.

E N D
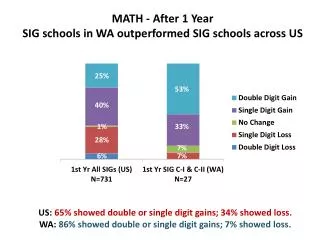
25% MATH - After 1 YearSIG schools in WA outperformed SIG schools across US 53% 40% 1% 33% 28% 7% 6% 7% US: 65% showed double or single digit gains; 34% showed loss. WA: 86% showed double or single digit gains; 7% showed loss.
READING - After 1 YearSIG schools in WA outperformed SIG schools across US 15% 15% 26% 26% 49% 44% 29% 15% 15% 8% US: 64% showed double or single digit gains; 37% showed loss. WA: 70% showed double or single digit gains; 15% showed loss.
SUSTAINING GAINS - After 2 Years SIG Cohort I (N = 17 Schools) 15% 29% 26% 76% 41% • Notes on data for this slide: • WA: Data based on 2010-11 and 2011-12 State Assessments. • US: No 2-year data were available. 12% 12% 18% 12% Math: 88% showed double or single digit gains; 12% showed loss. Reading: 70% showed double or single digit gains; 18% showed loss.
20% 20% 29% 29% 33% 33% ELEMENTARY LEVEL - After 1 Year US showed both double and singledigit losses in M and R. WA showed single digit loss in R. 67% 67% 29% 29% 50% 50% 41% 41% 44% 67% 22% 24% 24% 25% 25% 11% 33% 11% 11% 6% 6% 5% 5% Math: US – 70% showed gains; 30% showed loss. WA - 89% showed gains; none showed loss. Reading: US - 70% showed gains; 30% showed loss. WA - 77% showed gains; 11% showed loss.
MIDDLE SCHOOL LEVEL - After 1 YearUS showed bothdouble and singledigit losses in M and R. WA showed single digit losses in M and R. 47% 6% 6% 19% 20% 19% 21% 29% 21% 25% 43% 43% 19% 67% 53% 54% 29% 29% 44% 50% 47% 43% 41% 36% 75% 50% 30% 6% 21% 28% 30% 7% 21% 28% 24% 25% 33% 14% 14% 6% 10% 10% 14% 6% 6% 7% 5% Math: US - 66% showed gains; 34% showed loss. WA - 79% showed gains; 14% showed loss. Reading: US - 60% showed gains; 40% showed loss. WA - 65% showed gains; 14% showed loss.
HIGH SCHOOL LEVEL - After 1 Year US showed losses in M and R. WA showed losses in M and R. 47% 6% 6% 19% 20% 15% 19% 21% 29% 27% 21% 29% 25% 43% 43% 19% 57% 67% 53% 54% 29% 47% 29% 29% 38% 44% 50% 47% 43% 41% 36% 1% 14% 75% 50% 29% 30% 6% 29% 21% 28% 27% 30% 14% 7% 21% 28% 24% 25% 33% 14% 14% 14% 14% 6% 7% 10% 8% 10% 14% 6% 6% 7% 5% Math: US - 65% showed gains; 34% showed loss. WA - 86% showed gains; 14% showed loss. Reading: US - 62% showed gains; 37% showed loss. WA - 58% showed gains; 28% showed loss.
23% 26% 29% 38% 25% PROGRESS BY LOCALE - MATH After 1 Year SIG schools in WA outperformed SIG schools across US 57% 50% 53% 100% 100% 42% 40% 42% 35% 32% 1% 33% • Notes: • URBAN: Over 50% of US SIGs are urban; only 25% of WA SIGs are urban. • RURAL: Over 50% of WA SIGs are rural; only 19% of US SIGs are rural. 21% 1% 28% 1% 28% 7% 6% 19% 7% 23% 14% 30% 27% 14% 14% 11% 12% 5% 3% US: At least 30% showed loss in each locale. WA: 14% showed loss in one locale (Rural).
PROGRESS BY LOCALE – READING After 1 Year SIG schools in WA outperformed SIG schools across US 15% 14% 14% 15% 15% 28% 33% 33% 25% 53% 39% 47% 40% 50% 71% 56% 43% 33% 67% 1% 33% • Notes: • URBAN: Over 50% of US SIGs are urban; only 25% of WA SIGs are urban. • RURAL: Over 50% of WA SIGs are rural; only 19% of US SIGs are rural. 28% 28% 7% 28% 28% 14% 26% 6% 7% 33% 14% 11% 14% 14% 7% 4% US: At least 30% showed loss in each locale. WA: Less than 15% showed loss in Urban, Suburban, & Rural; 33% showed loss in Town.