Download
1 / 38
380 likes | 414 Views
Explore datasets and reports on global carbon cycles, ecosystems, and climate change interactions, with a focus on ocean biology and coastal carbon dynamics. Access integrated global analyses and expert insights at the NASA MODIS Science Team Meeting.

E N D
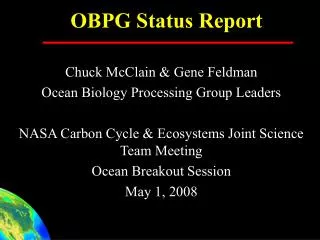
Satellite Ocean Color/Biogeochemistry Climate Data Records Chuck McClain Ocean Biology Processing Group NASA MODIS Science Team Meeting March 22-24, 2005
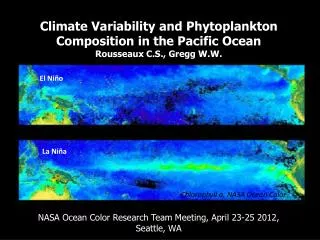
Seasonal BiosphereOcean Chlorophyll-a & Terrestrial NDVI Data from SeaWiFS
Integrated global analyses Report Carbon Cycle and Ecosystems Roadmap Human-Ecosystems-Climate Interactions (Model-Data Fusion, Assimilation); Air-Sea Flux Sub-regional sources/sinks Funded T High-Resolution Atmospheric CO2 Unfunded Southern Ocean Carbon Program, Air-Sea CO2 Flux Process controls; errors in sink reduced Partnership Models w/improved ecosystem functions T= Technology development T Physiology & Functional Types Reduced flux uncertainties; coastal carbon dynamics Coastal Carbon = Field Campaign Global Ocean Carbon / Particle Abundance Reduced flux uncertainties; global carbon dynamics Goals: Global productivity and land cover change at fine resolution; biomass and carbon fluxes quantified; useful ecological forecasts and improved climate change projections T Vegetation 3-D Structure, Biomass, & Disturbance Terrestrial carbon stocks & species habitat characterized Global CH4;Wetlands, Flooding & Permafrost CH4 sources characterized and quantified Knowledge Base Global Atmospheric CO2 (OCO) Regional carbon sources/sinks quantified for planet N. American Carbon Program N. America’s carbon budget quantified Land Use Change in Amazonia Effects of tropical deforestation quantified; uncertainties in tropical carbon source reduced 2002: Global productivity and land cover resolution coarse; Large uncertainties in biomass, fluxes, disturbance, and coastal events Models & Computing Capacity Process Understanding Case Studies Improvements: P Land Cover (Landsat) Bridge (LDCM) Land Cover (OLI) Systematic Observations Ocean Color (SeaWiFS, MODIS) Ocean/Land (VIIRS/NPP) Ocean/Land (VIIRS/NPOESS) Vegetation, Fire (AVHRR, MODIS) Vegetation (AVHRR, MODIS) IPCC IPCC 2008 2010 2012 2014 2015 2002 2004 2006 Global C Cycle Global C Cycle NA Carbon NA Carbon
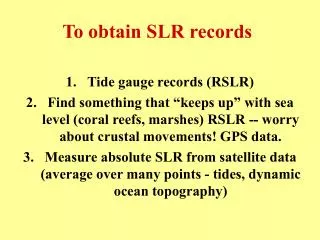
Data Requirements for Climate Research: Climate Data Records • Long-term continuous time series • Must span interannual and short-term natural variability (e.g., ENSO) • Necessarily requires data from multiple missions (e.g., CZCS to NPOESS) • Must include most recent data, e.g., NPP/VIIRS • Continuous ccean color time series starts in 1996 with ADEOS-I/OCTS • Must minimize data gaps to avoid aliasing of natural climate oscillations (e.g., ENSO) • Highest possible quality (satellite & in situ) • Must not include significant sensor artifacts and trends • Decadal scale variability and climate trends are small and can be easily confused with sensor drift • Ocean color products are particularly sensitive to sensor characterization/calibration errors (e.g., 1% error in calibration produces about a 10% error in water-leaving radiance) • Must be validated with ample highly accurate field data • Requires reprocessings (e.g., SeaWiFS has been reprocessed 5 times in 7.5 years) • Consistency between satellite data sets • Must be cross-calibrated and processed using similar algorithms, i.e, no abrupt transitions between data sets • Requires periodic reprocessings to improve products & maintain consistency
Historical Ocean Color Accuracy Goals • Sensor radiometric calibration • ±5% absolute • ±1% band-to-band relative • Water-leaving radiances • ±5% absolute • Chlorophyll-a • ±35% over range of 0.05-50.0 mg/m3 Current Ocean Biogeochemistry CDRs. Community presently revising product suite & CDR requirements. These accuracy specifications are being reconsidered based on experience with SeaWiFS & MODIS.
Infrastructure Requirements for CDR Development • Protocols for laboratory & in situ observations • Advanced instrumentation development & ongoing instrument performance evaluations • Calibration and data analyses round robins • In situ data archive and standardized QC procedures • Algorithm development (atmospheric & bio-optical) • On-orbit calibration capabilities • On-board methods (e.g., lunar data) • Vicarious methods (e.g., MOBY) • Multi-mission reprocessing capability
Ocean Biology Processing System Future (NPP) Present (EOS, other) Data Set Category: Funding Source Historical (REASoN-CAN) NPP VIIRS Aqua MODIS Terra MODIS# SeaWiFS GSFC DAAC CZCS & OCTS Reconfigurable & Scalable • Science • Community • Interactive • Knowledgeable Staff • Enabling Activities • (SeaBASS, SeaDAS, • Calibration RR, etc.) • Flexible • Processing • Multiple Missions • Rapid Reprocessing • Parallel Processing • Streams (operational, • algorithm & cali- • ration testing, eval- • uation products) • MAIN PROCESSING SYSTEM • Data from multiple satellite and instrument types • In-situ, ancillary, and other data L1 DATA L1-L3 DATA Data Users OBPG Management & Staff Community Agreed Standards and Protocols MCST* NASA HQ Program Management NASA Flight Projects Science Community In Situ Data * MODIS Characterization Support Team (NASA/GSFC) # Terra MODIS OC processing suspended in Jan. 2004
Calibration Validation Paradigm Satellite Calibration Elements: • Laboratory - before launch, sensor is calibrated in lab • On-orbit - daily solar and monthly lunar observations are used to track changes in sensor response • Vicarious - comparison of data retrievals to in-water, ship, and airborne sensors is used to adjust instrument gains
Ocean Optics Protocols for Satellite Ocean Color Sensor Validation Original Protocols: • Mueller & Austin 1992, Ocean Optics Protocols for SeaWiFS Validation, NASA TM 104566, Vol. 5, 43 pp. Revisions and Other Protocols: • Mueller & Austin 1995, Revision 1,Volume 25 in the SeaWiFS Technical Report Series. • Fargion & Mueller 2000, Revision 2, NASA TM 2000-209966. • Fargion et al., 2001, AOT Protocols,NASA TM 2001-209982. • Mueller et al., 2002, Revision 3, NASA TM 2002-21004 (Vol.1-2). • Mueller et al., 2003, Revision 4, NASA TM 2003-211621 (Vol. 1-6).
MOBY: Vicarious Calibration MOBY used to adjust prelaunch calibration gains for visible bands using satellite-buoy comparisons.
SeaWiFS Bio-optical data Archive & Storage System (SeaBASS) Data from over 1360 cruisesApparent Optical Property (AOP); Chlorophyll-a (CHL); Aerosol Optical Thickness (AOT)
SeaWiFS & SIMBIOS Calibration Round Robins(RR experiments in 1992, 1993, 1996, 1998, 1999, 2001, & 2002) Goals • Verify that all labs are on the same radiometric scale • Document calibration protocols • Encourage the use of standardized calibration protocols • Identify where the protocols need to be improved Radiance Calibrations (spheres & plaques) SeaWiFS Transfer Radiometer (SXR-1 & -2)
Field MeasurementTechnologyDevelopment Various in-water & above water radiometers SeaWiFS Quality Monitor (SQM) (NIST/NASA-developed portable field source for stability monitoring)
SeaWiFS Rotating telescope 412, 443, 490, 510, 555, 670, 765, 865 nm bands 12 bit digitization truncated to 10 bits on spacecraft 4 focal planes, 4 detectors/band, 4 gain settings, bilinear gain configuration Polarization scrambler: sensitivity at 0.25% level Solar diffuser (daily observations) Monthly lunar views at 7° phase angle via pitch maneuvers NPP/VIIRS SeaWiFS-like rotating telescope MODIS-like focal plane arrays No polarization scrambler Solar diffuser with stability monitor 7 OC bands (412, 445, 488, 555, 672, 746, 865 nm) MODIS (Ocean Color) Rotating mirror 413, 443, 488, 531, 551, 667, 678, 748, 870 nm bands 12 bit digitization 2 Vis-NIR focal planes, 10x40 detector arrays No polarization scrambler: sensitivity at ~3% level Spectral Radiometric Calibration Assembly (SRCA) Solar diffuser (observations every orbit), Solar Diffuser Stability Monitor (SDSM) Monthly lunar views at 55° phase angle via space view port SeaWiFS, MODIS, & VIIRS
SeaWiFS Lunar Calibration Stability Tracking Lunar calibration: Monthly views of the moon at ~ 7° phase angle. Gradual monotonic degradation primarily in NIR bands.
MOBY-based Vicarious Band 1 Gain Factors •Overpasses used in operational gain determination Overpasses that failed gain analysis Q/C criteria
SeaWiFS Data Quality: Global Consistency & In Situ Verification Field Validation: Lwn’s Temporal Consistency Field Validation: Chl-a * Lwn: Normalized Water-leaving Radiance
MODIS/Aqua Data Quality: Global Consistency & In Situ Verification Temporal Consistency Field Validation: Lwn’s Field Validation: Chl-a * Lwn: Normalized Water-leaving Radiance
MODIS(Aqua)/SeaWiFS Lwn Ratios (Hawaii):Vicarious Calibration Region • Most MOBY data used for vicarious calibration is near beginning & end of time series due to sun glint • Differences during 2003 are presently unexplained
MODIS/Aqua-SeaWiFS Global Lwn’s • Global averages very consistent. • Average differences within ±5%. Deep-Water Lwn Comparisons Solid Line: SeaWiFS Dashed Line: MODIS/Aqua Deep-Water Lwn Ratios
MODIS-Aqua/SeaWiFS Meridional Clear-Water Lwn Comparisons(Global Daily Mean) March, 2003 June, 2003 September, 2003 December, 2003
MODIS-Aqua & SeaWiFS Global Mean Chlorophyll Time Series Clear-water: chl-a < 0.15 mg/m3 Deep-water: depth > 1000 m • Coastal: depth < 1000 m • Primarily chlorophyll-a algorithm difference • at high concentrations Dashed line: MODIS Solid line: SeaWiFS
SeaWiFS & MODIS 4-Day Deep-Water Chlorophyll Images • 4 day composites, Summer 2002 • 0.01-1 mg/m^3 SeaWiFS MODIS (current operational processing)
Global Ocean Color/Biogeochemistry Trends: Recent Case Studies • 1997-1998 El Niño-La Niña Transition in Ocean & Land Productivity: Behrenfeld et al., Science, 2001 • Global marine productivity increased by 6 petagrams C/yr between Sept. 1997-August 2000 • Global terrestrial productivity showed no significant change, only regional changes • CZCS-SeaWiFS Decadal Primary Productivity Change: Gregg et al., Geophys. Res. Lett., 2003 • Marine productivity declined > 6% over past 2 decades • Global Chlorophyll-a Trends During 1998-2003: Gregg et al., Geophys. Res. Lett., , 2005 • Ocean gyre chlorophyll concentrations decreasing with increasing SST • Most oligiotropic areas also expanding: McClain et al., Deep-Sea Res., 2004
Global Patterns of Net Primary Production (NPP) & NPP Anomaly: 1998-2000 Boreal Winter Boreal Summer Behrenfeld, M., et al., Temporal changes in the photosynthetic biosphere, Science, 291, 2594- 2597, 2001.
Boreal Winter -10 0 10 Anomaly (g C m-2 month-1) Boreal Summer Global NPP Trends: 1997-2000 Oceans Global Monthly Mean NPP (Pg / m2) Land Monthly Anomaly Year Behrenfeld, M., et al., Science, 2001.
Decadal Scale Changes in Marine Productivity • 6% global decrease (2.8 Pg C/yr) in marine productivity based on CZCS (1978 -1986) & SeaWiFS (1997 - 2003) climatologies. • 70% of change at high latitudes. • Productivity tended to increase at low latitudes. Gregg, W.W., et al., Ocean primary production & climate: Global decadal changes, Geophys. Res. Lett., 15, doi: 10.1029/2003GL016889, 2003.
Locations of Most Significant Chlorophyll-a Change Based on SeaWiFS Time Series: 1998-2003 Gregg, W. W., et al., GRL, 2005.
Patterns of Chlorophyll-a Change: 1998-2003 Gregg, W.W., et al., GRL, 2005
Temporal Variations in Ocean Central Gyre Chlorophyll-a & SST Mean Values: 1998-2003 Gregg, W.W., et al., GRL, 2005
Maintaining the Ocean Color CDRs:Data Set Reprocessings • Historical Data Sets (REASoN-CAN, Watson Gregg, PI) • OCTS: Reprocessing scheduled for Spring 2005 • CZCS: Reprocessing scheduled for CY 2005 • SeaWiFS: Reprocessing completed in March 2005 (4 km data @ 3700X) • MODIS/Aqua: Reprocessing completed in March 2005 (1 km data @ 150X)
Ocean Color & Carbon Cycle/Ecosystems/Biogeochemistry: NASA Science Objectives • Why do we care about ocean biogeochemistry? • The ocean is a primary sink for anthropogenic CO2. • The ocean is the largest active reservoir of carbon. • Marine photosynthesis supports the entire marine foodweb (fisheries). • Major Ocean Biogeochemistry Science Questions • Ocean biology interannual variability (e.g., El Niño/La Niña) • Impacts of climate change/warming on marine ecosystems • Marine CO2 sequestration and role of “biological pump” • Impacts of population growth on coastal ecosystems • Data Requirements • Long time series of global observations (from multiple sensors) • Consistent and accurate on-orbit sensor calibrations • Improved accuracy in data products (e.g., chlorophyll-a, primary productivity), particularly in coastal regions • Adequate field/laboratory calibration & validation program
Ocean Color Data Processing, Cal/Val, & Algorithm Development Functions Distribution & Outreach Algorithm Development & Field Data Collection Sensor Calibration & Product Validation Data Processing • • Real-time ground • station support • • Data archive & • distribution • • Community processing • S/W (SeaDAS) • Data Synthesis • • Science campaign support • - Autonomous support • - User services • - Interface and data • processing capability • - RT data distribution • • Publication support • - Science writer/editor • • Education outreach • I/F with IPO & NOAA • I/F with NPP/CDMS • Maintenance and infrastructure improvements within GSFC • Climate data processing - Continuity data sets & data merger (historical/existing) - VIIRS Simulated data develop. End-to-end testing • Data storage - RDRs, Level-1, EDRs - Ocean & ancillary data • Algorithm testing & implementation (inc. new products) • Quality control/assurance - Continuity data sets - VIIRS • I/F with mission operations - Cal. strategies, schedules, and operations plans • Round robins - Visible - Thermal IR • Vicarious calibration - Data: MOBY, AERONET, ship - Data Analysis • Protocol development for measurement and analysis - SST, OC, Atm. Corr. • Instrument technology evaluation • I/F with sensor/satellite mission calibration and characterization activities/groups (e.g., NCST) • Q/C & archive in-situ data (product validation & algo. dev.) • Product validation - Discipline Processing Group - Science Team • Algorithms - Atmospheric correction - Quality masks & flags - Bio-optical - Sea surface temperature - Data merger (time/space) • Bio-optical & atmos. field data collection • Science leadership/coord • New product specification - Definition/Development - Resource/Performance Evaluation - Selection . Functions supported under NRAs Discipline processing functions Functions assumed by a NASA flight project, HQ, or another agency (NOAA)
Ocean Color 865 nm Band: No Vicarious Calibration • 865 nm measurements are used provide aerosol amounts in the atmospheric correction algorithm • SeaWiFS, MODIS, OCTS, VIIRS • Comparisons for SeaWiFS suggest that band 8 calibration may be 5-10% too high • - Southern Ocean band 8 gain study (~5-6%) • - Comparisons with University of Arizona ground measurements (within 10%) • - Comparisons with aerosol optical thickness data (AERONET & cruise data) • Scatter in results is large • SeaWiFS appears high
Time Series of Global Ocean Chl-a & Chl-a Anomaly, 1998-2000 Time Series of Global NDVI & NDVI Anomaly, 1998-2000 Behrenfeld, M., et al., Temporal changes in the photosynthetic biosphere, Science, 291, 2594-2597, 2001.