Download
1 / 15
160 likes | 296 Views
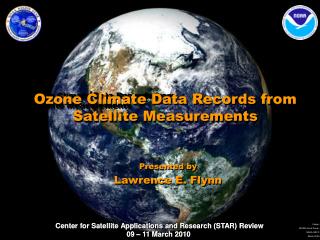
Ozone Climate Data Records from Satellite Measurements. Ozone Climate Data Records from Satellite Measurements. Presented by Lawrence E. Flynn. Center for Satellite Applications and Research (STAR) Review 09 – 11 March 2010. Requirement, Science, and Benefits. Requirement/Objective

E N D
Ozone Climate Data Records from Satellite Measurements Ozone Climate Data Records from Satellite Measurements Presented by Lawrence E. Flynn Center for Satellite Applications and Research (STAR) Review 09 – 11 March 2010
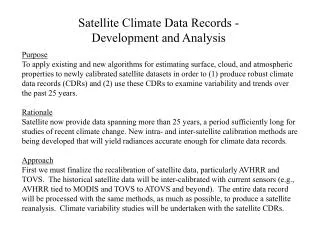
Requirement, Science, and Benefits Requirement/Objective • Mission Goal: Develop an integrated global observation and data management system for routine delivery of information on the current state of the climate • Research Area: Document and Understand Changes in Climate Forcings And Feedbacks, Thereby Reducing Uncertainty in Climate Projections Science • Can we create a sufficiently accurate time series of global total columnn and ozone profiles to monitor long-term changes in the ozone layer for climate change and atmospheric composition studies? Benefits • Provide accurate up-to-date information for national reports on the state of the ozone layer • Provide a data resource for international assessments • WMO Ozone Assessments for Montreal Protocol and Amendment participants • Support the Planned National Climate Services and their customers: • Decision makers on climate change policies and anthropogenic chemical releases • Research community studying atmospheric composition and climate change • General public with ultraviolet radiation exposure concerns
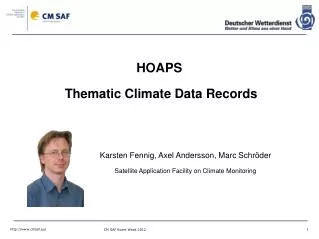
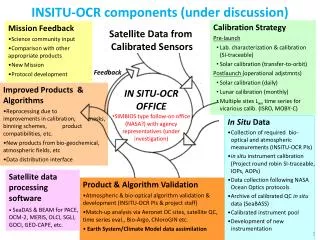
Challenges and Path Forward • Science challenges • Instruments’ characterization and inter-calibration still need improvements • Past record components have relied on occultation sensors and SSBUV under-flights for validation • Ground-based validation sites must be maintained • Researchers want improved vertical resolution • Next steps • Improve monitoring and evaluation/inter-calibration of existing components • Include currently operating satellites in the CDR • Transition Path • Updated CDR with new and reprocessed data approximately every two years to extend state of the ozone layer studies • Include additional monitoring in the ICVS • Build a reprocessing system for JPSS OMPS (SDS)
Instrument and Measurement Principles • Backscatter Ultraviolet (BUV) spectrometers on NOAA, NASA, and MetOp Polar Orbiting Satellites • Eight SBUV(/2): on Nimbus-7 and POES, 1978-present • TOMS: 1978-2003 • OMI: EOS Aura 2002-present • GOME-2: starting with MetOp-A 2005 • OMPS: JPSS starting with NPP in 2011 • Measuring BUV from 250 to 380 nm Strengths: • Ratio of Solar irradiance to Earth radiance • Absorbing and reflectivity pair method for total ozone • Maximum likelihood retrievals for profiles Weaknesses: • Vertical resolution of 7 KM or greater. • Sunlit Earth only Typical mid-latitude Version 8 SBUV/2 Averaging Kernel. The line styles cycle through three selections from top to bottom.
Analysis of Instrument Degradation and Changes • The record is composed of data from multiple SBUV/2 missions • Measurement residuals are monitored • Internal consistency is tested • Analysis leads to improved characterization of time-dependent and relative calibration • Reprocessing is performed for full record for satellite of interest. Initial Measurement Residuals 5% Residual Update to NOAA-18 Calibration 296 nm Comparisons between B-pair and D-pair are used to estimate calibration adjustments for total ozone channels 2%
…/Calibrate/Reprocess/Validate/… Vicious Circle 2% 1960 1970 1980 1990 20002010 YEAR Total Ozone (Best and Profile) Comparisonsbetween reprocessed NOAA SBUV/2 and Dobson Stations • Solar Diffusers and on-board calibration lamps track instrument throughput • Internal consistency methods are used to check results (e.g., B/D Pairs, Langley method, measurement residuals) • Vicarious calibration is obtained by monitoring Antarctic and Greenland ice sheet reflectivity • Frequent reprocessing using improved characterization and calibration analysis • Satellite time series and trends are compared to those derived from other observing systems both ground-based • Dobson and Umkehr Networks • NDACC Network for LIDAR and MW instruments • Ozonesondes collected at the WOUDC and in SHADOZ and satellite products • Limb (MLS) and occultation (SAGE) • Additional monitoring and comparisons are in the Integrated Calibration and Validation System (ICVS) Figure from V. Fioletov et al. at the 2008 QOS showing deseasonalized global mean ozone time series from SBUV(/2) and other sources.
30-Year SBUV(/2) Atmospheric Ozone Climate Data Record • Intercalibrated 30-year (1979-2008) SBUV(/2) CDR • DVD release (2004) and ftp update (2008) • Total column ozone • Ozone vertical profiles • Path to Assessments • NOAA’s Composite time series • NASA’s Merged time series Monthly average anomaly values (percent) of zonal mean total ozone, as a function of latitude (80ºN to 80ºS) and time (January 1979 to December 2009). The anomalies are derived relative to each month's 1979 to 2008 average. Long-term ozone variations may be readily seen. The largest anomalies are found for the polar regions in each hemisphere in winter-spring months, with positive anomalies of more than 10 percent in the earlier years changing to negative anomalies of greater than -10 percent for the 1990s and beyond.
Challenges and Path Forward • Science challenges • Instruments’ characterization and inter-calibration still need improvements • Past record components have relied on occultation sensors and SSBUV under-flights for validation • Ground-based validation sites must be maintained • Researchers want improved vertical resolution • Next steps • Improve monitoring and evaluation/inter-calibration of existing components • Include currently operating satellites in the CDR • Transition Path • Updated CDR with new and reprocessed data approximately every two years to extend state of the ozone layer studies • Include additional monitoring in the ICVS • Build a reprocessing system for JPSS OMPS (SDS)
References Solar Backscatter Ultraviolet Instrument (SBUV/2) Version 8 Ozone Retrieval Algorithm Theoretical Basis Document (V8 ATBD), Edited by L. Flynn, 2007, http://www.star.nesdis.noaa.gov/smcd/spb/calibration/icvs/sbuv/doc/SBUV2_V8_ATBD_020207.pdf Kondragunta, S., et al., 2005: Vertical Structure of the Anomalous 2002 Antarctic Ozone Hole. J. Atmos. Sci., 62, 801–811. http://ams.allenpress.com/perlserv/?request=get-abstract&doi=10.1175%2FJAS-3324.1 NOAA Bulletin: Southern Hemisphere Winter Summary, 2008, Contributors: Angell, J.K., Flynn, L.E., Hofmann, D., Johnson, B.J., Long, C.S., Oltmans, S.J., Zhou, S. http://www.cpc.ncep.noaa.gov/products/stratosphere/winter_bulletins/sh_08/ Flynn, L.E. et al., (2009) Measurements and products from the Solar Backscatter Ultraviolet (SBUV/2) and Ozone Mapping and Profiler Suite (OMPS) instruments, International Journal of Remote Sensing, vol. 30, issue 15, pp. 4259-4272. WMO (World Meteorological Organization), Scientific Assessment of Ozone Depletion: 2006, Global Ozone Research and Monitoring Project—Report No. 50, 572 pp., Geneva, Switzerland, 2007. http://www.esrl.noaa.gov/csd/assessments/2006/ Herman, J.R., et al., (1991), A New Self-Calibration Method Applied to TOMS and SBUV Backscattered Ultraviolet Data to Determine Long-Term Global Ozone Change, Journal of Geophysical Research, 96(D4), 7531–7545. Bhartia, P.K., et al. (1995), Application of the Langley plot method to the calibration of the solar backscattered ultraviolet instrument on the Nimbus 7 satellite, J. Geophys. Res., 100(D2), 2997–3004. Hilsenrath, E., et al. (1995), Calibration of the NOAA 11 solar backscatter ultraviolet (SBUV/2) ozone data set from 1989 to 1993 using in-flight calibration data and SSBUV, J. Geophys. Res., 100(D1), 1351–1366.
“Split” Ozone Hole as observed with SBUV/2 Total Ozone for September 25, 2002
Langley Method(Ascending/Descending) Physics 252 nm 306 nm
Time Chart for some BUV Missions Table 1. Timeline of some BUV instruments. * Nadir instruments only, no Limb Profiler.