Download
1 / 19
190 likes | 333 Views
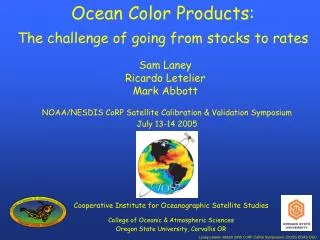
Ocean Color Products: The challenge of going from stocks to rates. Sam Laney Ricardo Letelier Mark Abbott. NOAA/NESDIS CoRP Satellite Calibration & Validation Symposium July 13-14 2005. Cooperative Institute for Oceanographic Satellite Studies College of Oceanic & Atmospheric Sciences

E N D
Ocean Color Products: The challenge of going from stocks to rates Sam Laney Ricardo Letelier Mark Abbott NOAA/NESDIS CoRP Satellite Calibration & Validation Symposium July 13-14 2005 Cooperative Institute for Oceanographic Satellite Studies College of Oceanic & Atmospheric Sciences Oregon State University, Corvallis OR Laney-Letelier-Abbott 2005 CoRP CalVal Symposium, CIOSS COAS OSU
How ocean phytoplankton standing stocks relate to primary productivity in the ocean Current remote sensing approach for estimating marine primary productivity, & some concerns with it How remote sensing of chlorophyll fluorescence is providing insight into photosynthetic variability that affects estimates of primary production Overview: Laney-Letelier-Abbott 2005 CoRP CalVal Symposium, CIOSS COAS OSU
Stocks (or pools): Biomass, abundance “standing stock” Good at measuring stocks of phytoplankton with remote sensors: SeaWiFS “chlorophyll” #1 scientific use of ocean color remote sensing data: phytoplankton chl Rates (or flux): Flow of energy or matter through a stock “primary production” “sustainable yield” “carbon sequestration” Important issues in marine ecology, but… Not nearly so easy to assess using remote sensing Laney-Letelier-Abbott 2005 CoRP CalVal Symposium, CIOSS COAS OSU
Challenges of aquatic photosynthesis: (compared to remote sensing terrestrial production) • Optical: • Need large dynamic range from a weak signal • Physiological: • C uptake rates ~ 10x standing stock (0.2x for land) • Considerable spatiotemporal variability in stocks • Phytoplankton very different photosynthetically • Chl not major absorbing pigment in some phytoplankton • Wide physiological range of carbon:chl (factor of 10) Laney-Letelier-Abbott 2005 CoRP CalVal Symposium, CIOSS COAS OSU
Top of the Atmosphere Radiances (Lsat) Image: OPP IMCS Rutgers Radiative Transfer Models Image: NASA Normalized Water Leaving Radiances (nLw) Photosynthetic efficiency (P) (derived empirically from SST) Photosynthetic Available Radiation (PAR) = 400-700 nm Ocean Chlorophyll Algorithms (empirical or semi-analytical) Sea surface Chl a concentrations Primary Production model Higher level model (e.g. export production, carbon sequestration, fisheries) Laney-Letelier-Abbott 2005 CoRP CalVal Symposium, CIOSS COAS OSU
0.016 0.016 0.014 0.014 Phytoplankton absorption = [chl] a* PAR (sunlight) 0.012 0.012 0.01 0.01 Phytoplankton fluorescence by chl Absorbed Radiation by Phytoplankton (ARP PAR chl a*) Lu/Es Lu/Es 0.008 0.008 0.006 0.006 0.004 0.004 0.002 0.002 0 0 Fluorescence F Photosynthesis P 400 400 450 450 500 500 550 550 600 600 650 650 700 700 Wavelength, nm Wavelength, nm Chl fluorescence, photosynthesis, & production: PriProd = PAR ([chl]a*) FP So, P - F are inversely related: F = PAR ([chl]a*) FF Laney-Letelier-Abbott 2005 CoRP CalVal Symposium, CIOSS COAS OSU
0.8 Lu683 0.7 0.6 Lu1 0.5 FLH Exitance, W m-2 µm-1 0.4 0.3 0.2 Lu2 FLH = Lu683 – Baseline683 Baseline683 = Lu1 - [(Lu1-Lu2)/(lLu2-lLu1)]*(683-lLu1) 0.1 0 600 620 640 660 680 700 720 740 760 Wavelength, nm Chl fluorescence can be measured by modern remote sensors, e.g. MODIS or MERIS Fluorescence Line Height (FLH) Sea surface upwelling irradiance (calculated @ 10 mg Chl m-3 ) Laney-Letelier-Abbott 2005 CoRP CalVal Symposium, CIOSS COAS OSU
FLH validation: Coastal: - GLOBEC - COAST Open ocean: - HOT cruises - Southern Ocean - MOBY mooring Laney-Letelier-Abbott 2005 CoRP CalVal Symposium, CIOSS COAS OSU
MODIS Terra FLH, W m-2mm-1 sr-1 1:1 Oregon Drifters FLH, W m-2mm-1 sr-1 In situ vs. remotely sensed FLH: Oregon coastal region Laney-Letelier-Abbott 2005 CoRP CalVal Symposium, CIOSS COAS OSU
Validating MODIS Fluorescence: Line ‘A’ Frontal regions Line ‘B’ From Hoge et al. Laney-Letelier-Abbott 2005 CoRP CalVal Symposium, CIOSS COAS OSU
Images: ocean at mesoscales, a decoupling between FLH & chl FLH chl • Differences in? • species composition • environmental forcing Laney-Letelier-Abbott 2005 CoRP CalVal Symposium, CIOSS COAS OSU
B = frontal regions C = nearshore A = offshore Observe changes in FLH/chl during the day: nearshore, frontal, and pelagic regions A B C Chl FLH Laney-Letelier-Abbott 2005 CoRP CalVal Symposium, CIOSS COAS OSU
Can associate variability in FLH/PAR with photosynthetic differences resulting from nutrient availability Nitrate-limited Nitrate-starved FLH FLH / PAR PAR irradiance (mol quanta m-2 s-1) Laney-Letelier-Abbott 2005 CoRP CalVal Symposium, CIOSS COAS OSU
FLH: status & future directions • Field validation efforts suggest that FLH is a robust remote sensing product • Lab validation shows that FLH helps to identify & quantify key physiological aspects of photosynthesis & production • To improve remote sensing PP with FLH, need to know its diurnal dynamics. Chl fluorescence from geosynchronous sensor (HES-CW on GOES-R)? Laney-Letelier-Abbott 2005 CoRP CalVal Symposium, CIOSS COAS OSU
e.g. Platt group Ocean color other important rates : Silicate flux Rate of N2 fixation e.g. Subramaniam group, Westberry Rate of calcification e.g. Balch group Laney-Letelier-Abbott 2005 CoRP CalVal Symposium, CIOSS COAS OSU
Acknowledgments: • Jasmine Nahorniak & Curt Vandetta (OSU MODIS Direct Broadcast Station) • NOAA/NESDIS funding through CIOSS • Dennis Clark (NOAA) • Wayne Esaias, Frank Hoge (NASA) Laney-Letelier-Abbott 2005 CoRP CalVal Symposium, CIOSS COAS OSU
Variability in patterns of chl and FLH MODIS Terra L2 1 km resolution scene (October 3rd 2001) – COAS/OSU Direct Broadcast Sea Surface Temperature Chl a Chl Fluorescence Line Height (°C) (mg m-3) (W m-2mm-1 sr-1) Laney-Letelier-Abbott 2005 CoRP CalVal Symposium, CIOSS COAS OSU
GLOBEC NEP AUGUST 2002 chlFLH semi-analytical (Huot & Cullen assuming ff = 0.006) chlFLH empirical (this study) In situ chl • Both FLH derived chl algorithms appear to slightly overestimate chl a fields. • They do not seem to reproduce the low values observed in situ. • Some of the differences between in situ and FLH derived could be due to time differences and sampling depth (in situ = 5 m depth) Laney-Letelier-Abbott 2005 CoRP CalVal Symposium, CIOSS COAS OSU
Relevance: • Aquatic photosynthesis affects global fluxes of C, N, O, & other bioelements • Response to climate change, ecosystem carrying capacities (e.g. fisheries), depend both on stocks & rates • Phytoplankton standing stocks and primary production correlate only on very large time & space scales Laney-Letelier-Abbott 2005 CoRP CalVal Symposium, CIOSS COAS OSU