Download
1 / 27
270 likes | 395 Views
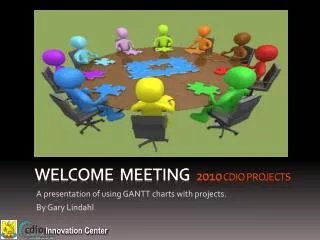
WELCOME Meeting 2010 cdio projects. A presentation of using GANTT charts with projects. By Gary Lindahl. My background - University. UIC Electronic Visualization Lab. University of Illinois at Chicago (UIC) Iowa State University (ISU). My background - University.

E N D
WELCOME Meeting 2010 cdio projects A presentation of using GANTT charts with projects. By Gary Lindahl
My background - University UICElectronic Visualization Lab University of Illinois at Chicago (UIC) Iowa State University (ISU)
My background - University ISUVirtual Reality Application Center University of Illinois at Chicago (UIC) Iowa State University (ISU)
UIC ISU ISU and UIC in America
My background - industry Fakespace Systems – USA John Deere - USA Christie Digital Systems – USA TechViz - USA BARCO – USA Consulting
Immersive-Display Technology CAVE™, HMD, Flat Tiled Displays, Curved Tiled Displays
GANTT Chart Simple example. Includes: List of task descriptions and a timeline.
Gantt chart purpose It is an effective tool for planning and scheduling operations. Useful to work with teams of people, managers, and customers.
Project planning TOOL Tool used internationally. Examples of professional solutions: Microsoft Project, SmartDraw, Oracle, Seimens http://en.wikipedia.org/wiki/List_of_project_management_software
The vertical line on the chart is the current-date indicator and indicates present and future status of the project as of that date. The bar is filled with two different colors to indicate progress and completion. Description of elements
Progress bar for the stage. These sections are the different stages of the project related to a CDIO project. Project stages Conception, Preliminary Research, Project Development, Testing and Validation, Presentation and Demonstration
Progress bar for each task and sub-task These are the tasks identified within each stage of the project. Project TASKS Tasks and Sub-tasks needed within each project stage. These will need to be updated based on the type of project’s requirements.
Next Step… How should I Use?
Organize…… Microsoft Excel Application. Download template file. Determine a student to lead in the group to manage and update this file. Determine a student to lead as a manager to plan the needed tasks and schedule.
Where to get GANtt chart? Download from the file server at this location. ftp://10.10.87.111/FORMS/PROJECT TOOLS/CDIOTemplate_2010_2011_ganttchart_rev_1.xls Username: Anonymous No Password.
Enter your data 1)Enter once, + Project Name
Enter your data 1)Enter once, + Project Name + Project Student Lead
Enter your data 1)Enter once, + Project Name + Project Student Lead + Project Start Date
Enter your data 1)Enter once, + Project Name + Project Student Lead + Project Start Date + Today’s Date
Enter your data 1)Enter once, + Project Name + Project Student Lead + Project Start Date + Today’s Date 2)Task Name
Enter your data 1)Enter once, + Project Name + Project Student Lead + Project Start Date + Today’s Date 2)Task Name 3) Task Start Date
Enter your data 1)Enter once, + Project Name + Project Student Lead + Project Start Date + Today’s Date 2)Task Name 3) Task Start Date 4) Task Duration of Days
Enter your data 1)Enter once, + Project Name + Project Student Lead + Project Start Date + Today’s Date 2)Task Name 3) Task Start Date 4) Task Duration of Days 5) Percentage of Days Completed
Enter your data 1)Enter once, + Project Name + Project Student Lead + Project Start Date + Today’s Date 2)Task Name 3) Task Start Date 4) Task Duration of Days 5) Percentage of Days Completed 6) Assign Task Lead Student