Download
1 / 74
840 likes | 1.2k Views
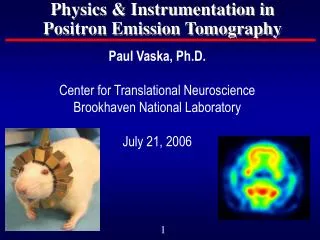
Positron Emission Tomography. Outline. PET Examples Imaging Goal Reconstruction/Data Requirements Method of Data Acquisition in PET Positron Decay/Annihilation Detectors/Scanner PET Tracers Data Acquisition Modes (2D/3D) Attenuation Degrading Effects Combined PET and CT.

E N D
Outline • PET Examples • Imaging Goal • Reconstruction/Data Requirements • Method of Data Acquisition in PET • Positron Decay/Annihilation • Detectors/Scanner • PET Tracers • Data Acquisition Modes (2D/3D) • Attenuation • Degrading Effects • Combined PET and CT
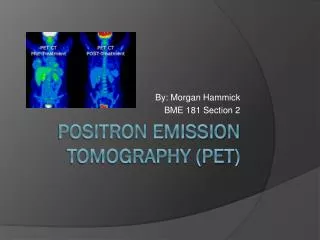
PET/CT FDG Breast Cancer Tracer: [F-18] FDG A glucose analog, Goes to regions of high metabolic activity. PET CT
Colon Cancer 10.9 mCi FDG 6 X ( 4 min Emission + 2.5 min Transmission) = 39 min
FDG PET FLT PET (different patient) MRI, T1+C FDG – Glucose metabolism. Normal gray matter tissue has high glucose metabolism. FLT – DNA synthesis/cellular proliferation. Normal brain has low signal.
Dynamic Imaging / Kinetic Modeling • During a scan, PET data can be acquired as a function of time with ~ arbitrarily good time resolution (limited by statistical/reconstruction considerations) • Can use time sequence of tracer uptake (dynamic PET) coupled with blood pool tracer measurements to determine parameters in a model of tissue uptake. • Leads to better understanding of mechanism of tracer uptake.
Dynamic Imaging / Kinetic Modeling Late time (Tumor) Early time (Carotid Artery)
K1 C1 k3 C2 Ca k2 k4 Dynamic Imaging / Kinetic Modeling Possible 2-Tissue Compartment Model for Fluorothymidine (FLT) Ca - Tracer concentration in blood C1 - Unphosphorolated tracer concentration in tissue C2 -Phosphorolated tracer concentration (preliminary step in the incorporation of thymidine into DNA) K’s: • Model parameters • Represent transfer rates between compartments (think pipe diameters) Significance example: In brain, K1 is determined by BBB integrity whereas k3 , the phosphorolation/proliferation rate is expected to better reflect tumor status. These quantities cannot be cleanly disentangled with single time-point imaging.
Imaging Goal • Main point: All nuclear medicine imaging studies involve administration of a molecule tagged with a radioactive atom (radiopharmaceutical or radio tracer). • Purpose: As opposed to some other modalities, the purpose of nuclear medicine is to provide functional information. Contrast this with, for example, xray and CT procedures, in which we are mainly looking at structure. • The particular function that we examine in a nuclear medicine mainly depends on the radiopharmeceutical used.
Imaging Goal Example: CT image of chest shows structure. Nuclear Medicine (PET) image shows metabolic activity. Tracer: [F-18] FDG Overlaid PET / CT image
Constraint: Have to work from outside (no slicing allowed). Goal: Obtain image or map of some property (for example radioactivity distribution) of this patient.
A line transecting the object. Definition: Line of Response (LOR):
With a complete set of LOR’s, every point in the object is intersected by lines in all directions.
Summary Input: integral of desired quantity for all LOR’s in object Output: map of quantity for entire object Reconstruction Algorithm Nuclear Medicine In: Line integrals of radioactivity concentration. Out: Image of radioacitity concentration
Example 1 - Internal Radioactivity An image of radioactivity distribution can be reconstructed if gamma-ray count rates are measured along “all” LOR’s. This can be done by collimated detectors (for example). The measured count rates are proportional to the total (integral) radioactivity along the LOR
Example 1 - Internal Radioactivity An image of radioactivity distribution can be reconstructed if gamma-ray count rates are measured along “all” LOR’s. This can be done by collimated detectors (for example). The measured count rates are proportional to the total (integral) radioactivity along the LOR
Example 1 - Internal Radioactivity An image of radioactivity distribution can be reconstructed if gamma-ray count rates are measured along “all” LOR’s. This can be done by collimated detectors (for example). The measured count rates are proportional to the total (integral) radioactivity along the LOR
Example 1 - Internal Radioactivity An image of radioactivity distribution can be reconstructed if gamma-ray count rates are measured along “all” LOR’s. This can be done by collimated detectors (for example). The measured count rates are proportional to the total (integral) radioactivity along the LOR
Reconstruction Result: Map of radioactivity concentration Example 1 - Internal Radioactivity -ray detector (x,y) = Activity concentration Rate of -ray emission along LOR* Measure: * emission rate is proportional to integral of activity concentration along LOR
Reconstruction The point of this is – The data we need require that we know: 1. where an emitted gamma ray hits the detector; 2. the direction from which the gamma ray came. In SPECT we use collimators. PET uses a different technique to get the same information.
p n Positron Decay Closeup • Beta Decay: + e+ This decay is not allowed for a free proton (energy conservation) Initial State Final State
PET : Positron Emission Tomography • Some neutron deficient nuclei decay by positron emission (+) decay. Example: F-18 O-18 + e+ + Half life: 109 minutes
e- e+ Positron - Electron annihilation PET Positron comes to rest (total distance traveled ~ 1mm) and interacts with ambient electron
Positron - Electron annihilation PET Result: Two back-to-back 511 keV photons traveling along a line that contains the point at which the annihilation took place.
PET In PET, the LOR upon which an annihilation took place is defined by the coincident observation of two 511 keV photons Gamma detectors Coincidence: Look for events within timeτ of each other. (typical τ: 10ns)
PET Detectors The PET scanner consists of a cylindrical grid of blocks, each containing a number individual detectors 15 cm (typical)
Block Detector Photomultiplier(s) Scintillation Crystals • Gamma ray hits crystal • It may interact producing scintillation light • Scintillation light is detected by photomultiplier tubes (PMTs) • Struck crystal determined by light distribution in PMTs Head on view
Example Block Detectors 6.4 mm x 6.4 mm 8x8 crystals/block 4.0 mm x 4.0 mm 13x13 crystals/block 6.3 mm x 6.3 mm6x6 crystals/block 4.7 mm x 6.3 mm8x6 crystals/block Most Common PET Scintillators: Bismuth germanate (BGO) Lutetium oxy-orthosilicate (LSO)
Positron Decay Nuclide half-life C-11 20.3 min N-13 10 min O-15 124 sec F-18 110 min Rb-82 75 sec e.g., 18F 18O + e+ +
PET Compounds Routinely Produced and Approved for Animal/Human Use [O-15]H2O (perfusion) [O-15]O2 (oxygen metabolism) [N-13]NH3 (myocardial perfusion) [F-18]FDG (glucose metabolism, cell viability) [C-11]raclopride (dopamine D2 receptor ligand) [C-11]PMP (acetylcholinesterase substrate) [carbonyl-C-11]WAY100635 (serotonin 5-HT1A receptor ligand) [C-11]flumazenil (central benzodiazepine receptor ligand) (+)[C-11]McN5652 (serotonin transporter ligand, active) (-)[C-11]McN5652 (serotonin transporter ligand, inactive) [C-11]PK-11195 (peripheral benzodiazepine receptor ligand) [C-11]β-CFT (dopamine transporter ligand) [C-11]PIB (beta amyloid imaging agent) [C-11]3-O-methylglucose (glucose transport) [C-11]DASB (serotonin transporter ligand) [F-18]FLT (thymidine kinase substrate, cell proliferation) [F-18]altanserin. (serotonin 5HT2A receptor ligand) [F-18] FMISO (tumor cell hypoxia)
PET Compounds Routinely Produced and Approved for Animal/Human Use [F-18]FDG (glucose metabolism, cell viability) FDG – FluoroDeoxyGlucose - a glucose analog FDG is now comercially available most places in the USA and throughout much of the world.
crossslices (n-1) Multiple Rings, 2D – 3D For n detector rings: 2D 3D direct slices (n) 3D- More counts 2D- Better ratio of good to bad counts septa total slices = 2n-1
Notice! We are always going to produce a 3D image of radiotracer distribution in PET 2D and 3D PET refer to the method of acquiring the raw data used to produce the final image.
The Problem: Attenuation of radiation by the patient • In a nuclear medicine study a gamma-ray emitted within the patient may be reabsorbed. Thus the quantities that we measure for each LOR are not just integrals of the radioactivity distribution. Instead they are a complicated function of both the activity distribution and the patient attenuation properties.
Attenuation of Radiation by Matter For Photons ( and x radiation) • Total interaction probability is expressed by Linear Attenuation Coefficient: • --> Units = 1/cm • is a function of material and gamma energy • Transmitted beam intensity (# of photons) decreases exponentially with distance: μ I0 x Photon survival probability
Attenuation of Radiation by Matter If a photon is emitted here traveling along the indicated LOR then the probability that it will survive attenuation is The integral is taken along the LOR starting at the emission point to the exit point. Thus the probability of attenuation depends on the point of emission along the LOR.