Download
1 / 31
320 likes | 569 Views
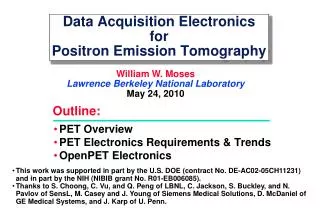
PET Overview PET Electronics Requirements & Trends OpenPET Electronics. Data Acquisition Electronics for Positron Emission Tomography. William W. Moses Lawrence Berkeley National Laboratory May 24, 2010. Outline:.

E N D
PET Overview PET Electronics Requirements & Trends OpenPET Electronics Data Acquisition ElectronicsforPositron Emission Tomography William W. Moses Lawrence Berkeley National Laboratory May 24, 2010 Outline: • This work was supported in part by the U.S. DOE (contract No. DE-AC02-05CH11231) and in part by the NIH (NIBIB grant No. R01-EB006085). • Thanks to S. Choong, C. Vu, and Q. Peng of LBNL, C. Jackson, S. Buckley, and N. Pavlov of SensL, M. Casey and J. Young of Siemens Medical Solutions, D. McDaniel of GE Medical Systems, and J. Karp of U. Penn.
Gamma Camera Nuclear Medicine • Patient injected with small amount of radioactive drug. • Drug localizes in patient according to metabolic properties of that drug. • Radioactivity decays, emitting gamma rays. • Gamma rays that exit the patient are imaged. • Well Established Clinical Technique • 10 Million Studies Annually
Positron Emission Tomography (PET) Ring of Photon Detectors • Radionuclide decays byemitting a positron (+ ). • + annihilates with e– from tissue, forming back-to-back511 keV photon pair. • 511 keV photon pairs detected via time coincidence. • Positron lies on line defined by detector pair. • Detects Pairs of Back-to-Back 511 keV Photons • Use Computed Tomography to Form 2-D Image
• MRI “Sees” Structure with 0.5 mm Resolution • PET “Sees” Metabolism with 4.0 mm Resolution MRI & PET Images of Epilepsy MRI PET
CT Image PET Image Fused Image Post-Therapy Combine PET & CT (Oncology) Images courtesy of Stig Larsson, Karolinska Institute • Anatomy from X-Ray CT, Function from PET • Current “Standard of Care”
Combine PET & CT (Cardiac) Image courtesy ofGustav von Schulthess, University Hospital, Zurich Anatomy from X-Ray CT, Function from PET
What Is A “PET Event”?(What Do You Need To Record?) • Non-TOF PET: A Chord — Defined By Two End Points • Time-of-Flight PET: A Chord and t
“Singles Event” “Singles Event” • Position (crystal of interaction) • Time Stamp (arrival time) • Energy Validation (=511 keV?) • Position (crystal of interaction) • Time Stamp (arrival time) • Energy Validation (=511 keV?) t What Is The Electronics Concept? • Identify “Singles Events” • Find Time Coincidences Between Singles Events w/ t • “Coincident Event” = Pair of Singles Events (Chord)
Numbers • 150-300 Detector Modules (25 cm2 each) per Camera • 100 kHz Typical Singles Rate per Module • 1 MHz Maximum Singles Rate per Module • 1 MHz Typical Coincidence Rate per Camera • 4 MHz Maximum Coincidence Rate per Camera • 1 ns fwhm Timing Resolution for Conventional PET • 250 ps fwhm Timing Resolution for TOF PET • Low Coincidence / Singles Ratio • Low Occupancy in Each Detector Module • Multiplex Singles Events
PET Detector Module Profile through Row 2 Array of Scintillator Crystals Y-Ratio Photomultiplier Tubes X-Ratio Decode Crystals Using Anger Logic (Light Sharing)
1 2 3 4 5 6 7 1 2 3 4 5 6 7 8 9 10 11 12 13 14 8 9 10 11 12 13 14 A B 15 16 17 18 19 20 21 15 16 17 18 19 20 21 22 23 24 25 26 27 28 29 30 31 32 33 34 35 22 23 24 25 26 27 28 36 37 38 30 40 41 41 C D 43 44 45 46 47 48 49 29 30 31 32 33 34 35 50 51 52 53 54 55 56 42 38 39 36 37 40 41 E=A+B+C+D Y=(A+B)/E X=(B+D)/E 43 44 45 46 47 48 49 50 51 52 53 54 55 56 Position Identification Y X • Identify Crystal of Interaction Using Lookup Table • Position Given by Crystal ID
No Yes No Energy Validation E • Yes/No Decision Based on Measured Energy • Individual Thresholds for Each Crystal • Implemented Using Lookup Table
Time Stamp TDC Detector Module From Central Timing Board CFD Stop Clock Master Clock Time Slice Boundary Start / Reset • “Raw” Time Stamp is Digitized Time Since Last Time Slice Boundary • Each Crystal Assumed to Have a • Different (But Constant) Propagation Delay • Propagation Delays Measured w/ Positron Sourceand Stored in a Lookup Table • Crystal by Crystal Correction Factor Added to “Raw” Time
Not Coincidence Single Single Single Single Coincidence Coincidence Coincidence Coincidence Coincidence Single Single Single Single Single Single Single Single Single Single Single Single Single Single Single Single Single Single tmax Identifying Time Coincidences Slice 1 Slice 2 Slice 3 Slice 4 Slice 5 Slice 6 Time • Break Time Into Slices (100–250 ns / slice) • Search for Singles Within tmax (4–12 ns) in Each Slice • Greatly Reduces Combinatorics
Siemens & GE Detector Topology Scintillator Crystal Array • 4 PMTs to Decode Event Position • Independent Modules Operating in Parallel
Siemens & GE System Architecture Position Position DetectorBoard MultiplexerBoard Time Time Energy Chord Detectors Coincidence Host PC Position Position DetectorBoard MultiplexerBoard Time Time Energy • Position, Time, & Energy Computed for Each Trigger • All Data Flow is Forward No Handshaking
Philips Detector Topology Scintillator Crystal Array • 7–20 PMTs to Decode Event Position • Highly Coupled—Each PMT Used in Many “Modules”
Philips System Architecture ADC Output DetectorBoard Coincidence Position Time Energy Chord PMT ID Detectors CoincidenceBoard Processing Board Host PC Position DetectorBoard Time Energy Coincidence ADC Output • Position & Energy Computed Only for Coincidences • Bidirectional Data Flow Handshaking
Vin Vin Vin ADC ADC ADC Vref Vref Vref Typical Front End Architecture PMTs Logic Gain Adjust, Integrate A A+B Crystal Lookup (X & Y ID) EnergyValidation (E & ID 511?) Time Stamp (T & ID T Stamp) Event Formatting Sum Y Gain Adjust, Integrate B B+D Sum X Gain Adjust, Integrate C E Gain Adjust, Integrate +5V D T TDC Sum CFD Corrections Done In Real Time, Outputs Singles Events
Vin Vin Vin ADC ADC ADC Vref Vref Vref Siemens Implementation (~1995) PMTs Gain Adjust, Integrate Custom ASIC A A+B Crystal Lookup (X & Y ID) EnergyValidation (E & ID 511?) Time Stamp (T & ID T Stamp) Event Formatting Sum Y Gain Adjust, Integrate B B+D Sum X Gain Adjust, Integrate C E Gain Adjust, Integrate +5V D T TDC Sum CFD Analog Done w/ Discretes, Digital Done w/ Custom ASIC
Vin Vin Vin ADC ADC ADC Vref Vref Vref Siemens Implementation (~2000) PMTs Custom ASIC Gain Adjust, Integrate FPGA & Memory A A+B Crystal Lookup (X & Y ID) EnergyValidation (E & ID 511?) Time Stamp (T & ID T Stamp) Event Formatting Sum Y Gain Adjust, Integrate B B+D Sum X Gain Adjust, Integrate C E Gain Adjust, Integrate +5V D T TDC Sum CFD Analog Done w/ Custom ASIC, Digital Done w/ FPGA
Vin Vin Vin Vin ADC ADC ADC ADC Vref Vref Vref Vref Siemens Implementation (~2005) PMTs Custom ASIC Free-Running (~75 MHz) Gain Adjust, Anti-Alias FPGA & Memory A A Crystal Lookup (X & Y ID) EnergyValidation (E & ID 511?) Time Stamp (T & ID T Stamp) Event Formatting +5V Gain Adjust, Anti-Alias B B +5V Gain Adjust, Anti-Alias C C +5V Gain Adjust, Anti-Alias D D +5V T TDC Sum CFD Op-AmpFree Running ADC, More Digital Done w/ FPGA
Nuclear Medicine Research Community Needs“Industrial-Strength” Electronics • Needs Can Be Met By Single, Flexible Design!
Electronics System Requirements • High-Performance • # of Channels, Rate, Energy, Timing, … • Very Flexible • Type of Detector, Camera Configuration,Event Word Definition • User-Modifiable • Schematics, Source Code, Knowledge Base • User-Friendly • Instructions, Documentation, Can Buy Boards Like Open Source Software!
Extract Timing Signal from Leading Edge Extract “Energy” from Area Under the Curve All Detector Outputs Look the Same Voltage 100 mV – 2 V Time • Tremendous Variation in How Outputs Are Combined • Combine Outputs in Firmware
Vin Vin Vin Vin ADC ADC ADC ADC Vref Vref Vref Vref OpenPET Implementation (~2010) Free-Running (80 MHz) PMTs Gain Adjust, Anti-Alias FPGA & Memory A Crystal Lookup (X & Y ID) EnergyValidation (E & ID 511?) Time Stamp (T & ID T Stamp) Event Formatting +5V A TDC Discriminator Gain Adjust, Anti-Alias B +5V B TDC Discriminator Gain Adjust, Anti-Alias C +5V C TDC Discriminator Gain Adjust, Anti-Alias D +5V D TDC Discriminator Analog Done w/ Discrete, More Digital Done w/ FPGA
8 Boards In 8 Boards In 8 Boards In DigitalMultiplexer Coincidence SupportBoard P P Host PC OpenPET System Architecture 16 AnalogSignals In DetectorBoard Detectors Data Control • Supports 256 Block Detectors (2048 With Multiplexers) • PSB + 8 DPBs Makes Nice Test Stand (32 Block Detectors)
Detector 1: Conventional Block Detector 12x12 array of 4x4x22 mm3 LSO crystals4 Hamamatsu R-9800 PMTs 11% 12% 12% 10% • Pre-Prototype Circuit Boards • Excellent Flood Map and Energy Resolution
Adapter Board 16x16 array to 16 Row & 16 Column Analog Sums Detector 2: SiPM Array 16x16 array 3x3 mm2 SiPMs Natural LSO Activity 3x3x20 mm3 & 3x3x30 mm3 LSO Pixel Intensity Energy x Count Rate Same Electronics with Very Different Type of Detector
Timing Resolution Test Pulse TOF Module Pair HPTDC (CERN) FPGA • 16 Channel TDC in Cyclone II FPGA • Performance Good Enough for Time-of-Flight PET
Vision • Open Source • Hardware, Firmware, and Software • Schematics, Gerbers, BOM,… • Active User Community • Share Software and Expertise • Module, Calibration, DAQ, Display,… • Spring Fall, 2010 • Detector & Support Boards Available • Work on Coincidence Board Begins Need Collaborator for Librarianship of Firmware and Software… http://OpenPET.LBL.gov