Maryland Accountability Program Overview and Performance Improvement Strategies
This presentation outlines the Maryland Accountability Program for the school years 2011-12 and 2012-13, focusing on significant changes from the ESEA flexibility waiver. It covers the Maryland School Progress Index (SPI), performance metrics in reading and math, and discusses root causes for underperformance, particularly among minority student populations. Strategies for professional development, high expectations for all students, and engaging lesson implementation are highlighted. Participants will work collaboratively to analyze data, identify gaps, and suggest interventions for improved outcomes in education.


Maryland Accountability Program Overview and Performance Improvement Strategies
E N D
Presentation Transcript
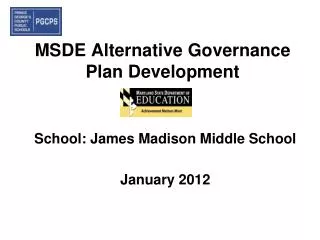
MSDE Accountability Model For 2011-12 and 2012-13 Presented by: Caroline Walker Rebecca Amani-Dove Portia White MaryLevinsohn-Klyap
DRAFT DRAFT
Discuss The data in your needs assessment tab reveal areas for improvement. What additional information is needed for your SIT to understand the root causes?
Needs Assessment Narrative Example After examining the data, it is evident that gaps in reading on MSA are apparent for “All students,” “Black/African American,” and “Hispanic” students. The root causes were identified as: • Professional development for all teachers in using differentiated instructional techniques • Having high expectations for all students by all teachers • Implementation of engaging lessons by all teachers for all students.
Table Discussion • Examine your data and gaps • Pick MSA or graduation rate data to examine • What are possible root causes? What strategies or activities would you suggest? • Swap roles https://inroads2.hcpss.org/SipApp
9-12 MD School Progress Index PreK-8
SPI Calculation ES Example % Prof of Target = % Proficient CY ÷ Target Weighted % Prof of Target = % Prof of Target x Content Weight Indicator Contribution = (Math + Read + Sci) x Indicator Weight School Index = (Achievement + Growth + Gap)
SPI Strand Categorization Scale School Progress Index
SPI Strand Categorization • Strand 1 • Meet and exceed the academic standards for all students • Strand 2 • Among the top 50% of schools in Maryland • Strand 3 • Increased needs for specific populations, not systemic problems • Strand 4 • Serious needs requiring systemic change • Strand 5 • Lowest achieving schools requiring differentiated services