Download
1 / 16
160 likes | 295 Views
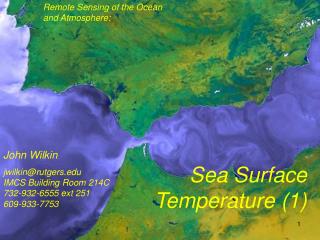
The Aura Mission. Remote Sensing of the Oceans and Atmosphere Tom Collow December 10, 2009. Quick Facts. Aura was launched on July 15, 2004 from Vandenburg Air Force Base, California. Aura is the last satellite in line on the A-train.

E N D
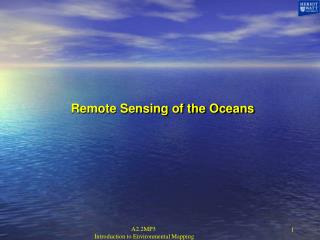
The Aura Mission Remote Sensing of the Oceans and Atmosphere Tom Collow December 10, 2009
Quick Facts Aura was launched on July 15, 2004 from Vandenburg Air Force Base, California. Aura is the last satellite in line on the A-train. “The Aura Mission studies the Earth’s ozone, air quality, and climate. It conducts research on the composition, chemistry, and dynamics of the Earth’s atmosphere.”
More Facts • Sun-synchronous polar orbit • 98° inclination (retrograde orbit) • Altitude is 705 km • Design life is 5 years with an operational goal of 6 years • Remember, it was launched in 2004 so the satellite is probably nearing the end of its usage
Instrumentation • The Aura satellite uses four different instruments to collect data. • HIRDLS – High Resolution Dynamics Limb Sounder • MLS – Microwave Limb Sounder • OMI – Ozone Monitoring Instrument • TES – Tropospheric Emission Spectrometer
Three Questions • Is the ozone layer recovering as expected? • What are the sources and processes that control atmospheric pollutants? • What is the quantitative impact of these constituents on climate change? Ozone hole progress, September 16, 2009
High Resolution Dynamics Limb Sounder • Limb infrared filter radiometer • 21 channels ranging from 6.2 to 17.76μm. • Vertical resolution of 1.2 km. • A good vertical resolution is important because most physical processes of interest to Aura occur on short vertical scales ( < 5 km.) • Measures variables in the upper troposphere, stratosphere, and mesosphere • A blockage on the instrument caused the aperture to only be able to see 20% of the Earth’s surface. Attempts to remove the blockage have failed but even so, the instrument can still make measurements at a high vertical resolution.
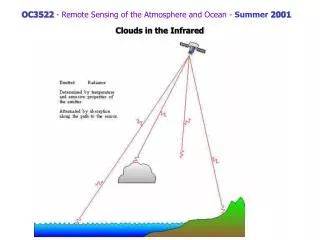
How it Works • First, radiance calibration is done by having the instrument view cold space ( just above the limb of the atmosphere) and then an internal blackbody target of known temperature. • Four channels measure the emission of CO2 which has a known mixing ratio. • Using that data, transmittance is then calculated. • The equation of radiative transfer is inverted to determine the vertical distribution of the Plank-black-body function from which temperature is a function of pressure. • Using the temperature profile, the Planck function profiles of the other constituents can be obtained. • These profiles are then used to calculate the transmittance of these compounds as well as the corresponding mixing ratios.
What does it Measure? • O3 • H2O • CH4 • N2O • NO2 • N2O • HNO3 • N2O5 • CFC11 • CFC12 • CIONO2 • Aerosols It can also determine the locations of cloud tops, sub-visible cirrus clouds, and polar stratospheric clouds using the H2O data. Sub-visible cirrus over eastern Africa and Saudi Arabia.
HIRDLS measurement of temperature over the Northern Hemisphere Source: http://www.eos.ucar.edu/hirdls/science/gallery/HirdlsTemp20050129.jpg
Mountain Waves as seen through temperature fluctuations Mountain waves reaching the mesosphere have been theorized but this is the first time they are actually being observed Source: http://aura.gsfc.nasa.gov/science/feature-030907.html
Microwave Limb Sounder • Five frequency bands ranging from 118 GHz to 2500 GHz (1 GHz = 1,000,000,000 s-1) • 1.5 – 3.0 km. vertical resolution • Measures atmospheric composition, temperature, humidity, and cloud ice in the upper troposphere, stratosphere, and mesosphere. • Unlike the HIRDLS which can “see” clouds, the MLS can “see” cloud ice. • The data is used to track the stability of the stratospheric ozone layer, help improve predictions of climate change and variability, and help improve understanding of global air quality.
Variables Measured ClO (chlorine monoxide) is the primary form of chlorine that destroys ozone. BrO (bromine monoxide) is the primary form of bromine that destroys ozone. It is also the primary form of bromine in the stratosphere. Measurements of H2O (water vapor) and cloud ice allows for a better understanding of climate change. H2O, HNO3 (nitric acid), and temperature provide information on processes that can lead to ozone loss in the antarctic and arctic. Measurements in the upper troposphere of O3 and CO are important for air quality research as these pollutants can be transported upwards from the boundary layer by convective processes and then transported great distances due to stronger winds there. The upper troposphere is highly significant in the transport of pollutants from Asia to North America. • H2O • O3 • CIO • BrO • HCl • OH • HNO2 • HNO3 • HCN • N2O • CO • HOCl • CH3CN • Cloud Ice • Temperature
2006 Antarctic ozone hole as seen by the Microwave Limb Sounder. Source: http://aura.gsfc.nasa.gov/science/feature-022207.html
Cloud ice measured by MLS (upper left) and compared to computer model simulations. There is a noticeable discrepancy over South America between the observation and the models. Source: http://aura.gsfc.nasa.gov/science/top10_cloudice.html
References • Goddard Space Flight Center. (2009). Aura atmospheric chemistry. Retrieved from http://aura.gsfc.nasa.gov/index.html • Goddard Space Flight Center. (2007). ‘Double record breaker’ 2006 anarctic ozone hole seen by MLS. Retrieved from http://aura.gsfc.nasa.gov/science/feature-022207.html • Goddard Space Flight Center. (2006). First global measurement of cloud ice in upper troposphere. Retrieved from http://aura.gsfc.nasa.gov/science/top10_cloudice.html • Goddard Space Flight Center. (2007). Spectacular mountain wave events observed by HIRDLS. Retrieved from http://aura.gsfc.nasa.gov/science/feature-030907.html • Jet Propulsion Laboratory. (2009). Microwave limb sounder. Retrieved from http://mls.jpl.nasa.gov/ • NASA. (2009). Aura understanding and protecting the air we breathe. Retrieved from http://www.nasa.gov/mission_pages/aura/main/index.html • Schoeberl, M.R., Douglass, A.R., Hilsenrath, E., Bhartia, P.K., Barnett, J., Gille, J, Beer, R., Gunson, M., Waters, J., Levelt P.F., & DeCola, P. (2004). Earth observing systems missions benefit atmospheric research [Electronic version]. EOS, Transactions, American Geophysical Union, 85(18), 177-184. • UCAR. (2008). High resolution dynamics limb sounder. Retrieved from http://www.eos.ucar.edu/hirdls/