Download
1 / 11
110 likes | 248 Views
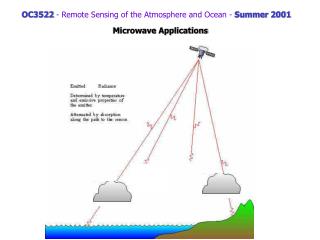
OC3522 - Remote Sensing of the Atmosphere and Ocean - Summer 2001. Clouds in the Infrared. The single scatter albedo ( w 0 ) describes the scatter vs absorbtion potential and is determined by the imaginary index of refraction. Clouds and Infrared Radiation.

E N D
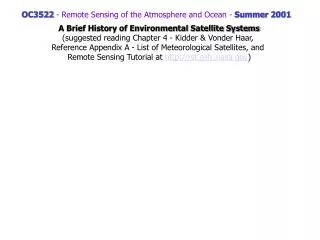
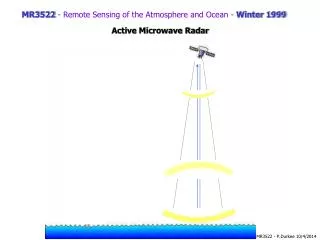
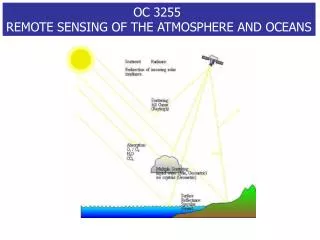
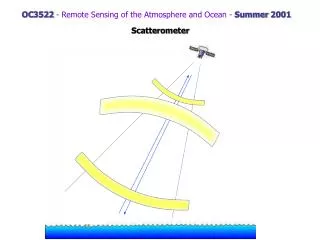
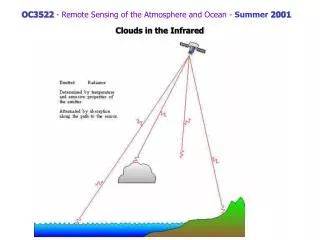
OC3522 - Remote Sensing of the Atmosphere and Ocean - Summer 2001 Clouds in the Infrared
The single scatter albedo (w0) describes the scatter vs absorbtion potential and is determined by the imaginary index of refraction Clouds and Infrared Radiation These high values result in w0@ 0.5 for IR ls
* 0 p rLWC 0 0 d(l,p) 0 T no sfc term 1 0 td(l,p) and dp = 1 within the layer at the top of the cloud so Lt = B(l,TCT) Let’s assume a perfect window for gaseous absorption, but there is a thick cloud layer in the middle of the atmosphere What is TCT?
TB(from AVHRR CH4) If the atmosphereis dry above cloud top, and the cloud is thick, then TB is a good estimate of the temperature of the cloud top.
cloud heights NOAA AVHRR 1,2, & 4 channels
COLD Cirrus Cirrus Stratus/Stratocumulus Land Land Cumulonimbus Cumulonimbus Ocean Ocean Snow/Ice Snow/Ice Cumulus Cumulus TB WARM BRIGHT DARK Information available in combinations of Visible and IR Imagery: Brightness
‘An "enhanced-V" signature is noted in the coldest temperatures (the orange/red enhancement) around the outer portions of the thunderstorm cirrus canopy, with a pocket of warmer cloud top temperatures (the yellow/green enhancement) just downstream. This enhanced-V and warm wake signature is a result of upper-level flow being diverted around the intense updraft region of the overshooting tops.’ (from: http://cimss.ssec.wisc.edu/goes/misc/warm_wake.html)
Cloud Drift Winds Check out for http://cimss.ssec.wisc.edu/goes/satwind/satwind.html details
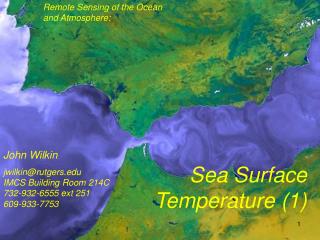
Multi-spectral Cloud Analysis The MODIS (Moderate Resolution Imaging Spectroradiometer) TERRA satellite Technical Information A large low-pressure system approached the U.S. East Coast on May 24, 2001, bringing with it forecasts of rain through Memorial Day weekend. This true-color image from th MODIS, flying aboard NASA's Terra satellite, shows the storm while it was centered over Illinois, Iowa, and Missouri. The smoke plume from a large fire northeast of Steinhatchee, Florida, is also visible to the lower right. In the Gulf of Mexico, the bright sun glint reveals a swath of relatively smooth water. The dark area in the patch of sun glint is a cloud shadow.