Download
1 / 19
190 likes | 339 Views
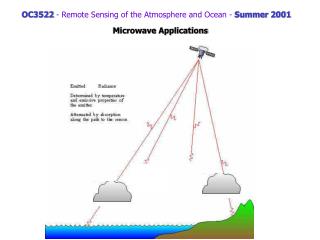
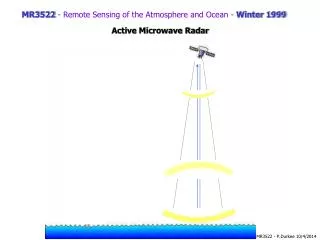
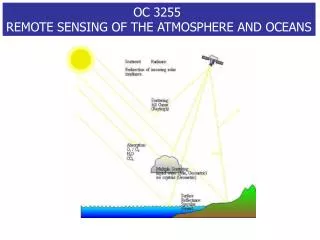
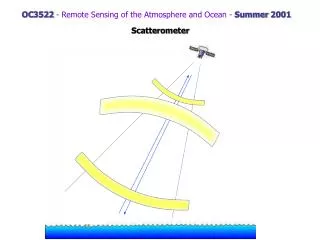
OC3522 - Remote Sensing of the Atmosphere and Ocean - Summer 2001. Scatterometer. s 0 increases with increasing wind speed for scatterometer angles. increased wind speed. Seasat Scatterometer Pattern. Scatterometer antennas. cross. downwind. cross. upwind. q = 25 o.

E N D
OC3522 - Remote Sensing of the Atmosphere and Ocean - Summer 2001 Scatterometer
s0 increases with increasing wind speed for scatterometer angles increasedwind speed
Seasat Scatterometer Pattern Scatterometerantennas
cross downwind cross upwind q = 25o primary max s0 wind min s0 A single measure of s0at some unknown angle relative to the wind direction produces a set of possible speeds and directions secondary max s0
s (q +90) 4 possible solutions 3 possible solutions 1 solution (note here q is used for azimuth)
Vector selection:consistency with the pressure field or consistency within a model analysis (continuity)
s (q +20) Now the solution collapses to two possible wind vectors What if a third view direction is added (q+20o)
The NASA Scatterometer (NSCAT) was launched on September 15, 1996, measuring global ocean surface wind velocity (both speed and direction). More than 9 months of observations are available. NSCAT • The instrument was operated continuously at a frequency of 13.995 Giga Hertz. • Six dual-polarized, 3-meter long, stick-like antennas collected backscatter data with a resolution of 50 km for nine months before loss. • Backscatter data was combined and processed to yield 268,000 globally distributed wind vectors per day.
http://www.eorc.nasda.go.jp/ADEOS/FirstImages/images/P47491.gifhttp://www.eorc.nasda.go.jp/ADEOS/FirstImages/images/P47491.gif
January July
Interesting Scatterometer sites: NASA Scatterometer Data Scatterometer Missions “NASA's Quick Scatterometer (QuikSCAT) was lofted into space at 7:15 p.m. Pacific Daylight Time on Saturday (6/19/99) atop a U.S. Air Force Titan II launch vehicle from Space Launch Complex 4 West at California's Vandenberg Air Force Base. The satellite was launched in a south-southwesterly direction, soaring over the Pacific Ocean at sunset as it ascended into space to achieve an initial elliptical orbit with a maximum altitude of about 800 kilometers (500 miles) above Earth's surface.” New Scatterometer SeaWinds on QuickSCAT And Data