Download
1 / 20
200 likes | 318 Views
This guide explores the fundamental concepts of demand and supply, enabling readers to grasp how these forces shape market prices and quantities. Key determinants of demand and supply are discussed, including substitutes, complements, and consumer preferences. The guide also explains the Law of Demand and the Law of Supply, emphasizing their relationships with price changes. It highlights market equilibrium and the adjustments that occur during surpluses and shortages, along with insights into market shocks and their predicted effects on prices and quantities.

E N D
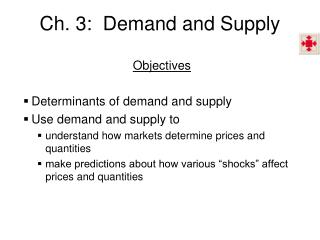
Ch. 3: Demand and Supply Objectives • Determinants of demand and supply • Use demand and supply to • understand how markets determine prices and quantities • make predictions about how various “shocks” affect prices and quantities
Markets and Prices • Market • any arrangement that enables buyers and sellers to get information and do business with each other. • Competitive market • a market that has many buyers and many sellers • no single buyer or seller can influence the price. • Money price of a good • the amount of money needed to buy it. • Relative price of a good • ratio of its money price to the money price of the next best alternative good • the opportunity cost of the good expressed in units of the other good.
Demand • Quantity demanded of a good or service • the amount that consumers plan to buy during a particular time period at a particular price. • The Law of Demand • Other things remaining the same, the higher the price of a good, the smaller is the quantity demanded. • The law of demand results from • a substitution effect • an income effect • Normal versus inferior good
Demand Demand • the entire relationship between the price of the good and quantity demanded of the good. Demand curve • shows the relationship between the QD of a good and its price, ceteris parabus
Demand • This figure shows a demand curve for gasoline • A rise in the price, ceteris paribus, brings a decrease in the QD and a movement along the demand curve. Price D # gallons per week
Demand A D-curve is also • Willingness-to-pay curve. • Willingness to pay measures marginal benefit. Price D # gallons per week
Demand • A Change in Demand • Quantity of the good that people plan to buy changes at each and every price • Shift of demand curve. • When demand increases, • QD increases at each and every price • the demand curve shifts rightward. • When demand decreases, • QD decreases at each and every price • the demand curve shifts leftward.
Demand Change in Demand vs. Change in Quantity Demanded
Factors that change demand • Prices of related goods • substitute in consumption • complement in consumption • Income • Normal good • Inferior good • Luxury good • Expected future prices • Population • Taxes on buyers • Consumer preferences
Supply Quantity supplied (QS) of a good or service • the amount that producers plan to sell during a given time period at a particular price. The Law of Supply • Other things remaining the same, the higher the price of a good, the greater is the quantity supplied. • results from tendency for the marginal cost of producing a good or service to increase as the quantity produced increases (more later) • Producers are willing to supply only if they at least cover their marginal cost of production.
Supply • Supply • the entire relationship between the quantity supplied and the price of a good. • Supply curve • shows relationship between QS and price of a good, ceteris paribus.
Supply Curve $ per gallon • A supply curve for gasoline. • A rise in the price, ceteris paribus, brings an increase in QS and a movement along the supply curve. S Gallons per day
Supply • A supply curve is also a minimum-supply-price curve. • The greater the quantity produced, the higher is the price that producers must be offered to be willing to produce that quantity. S Gallons per day
Supply • A Change in Supply • occurs when the quantity of the good that producers plan to sell changes at each and every price, so there is a new supply curve. • When supply increases, • QS increases at each and every price • supply curve shifts rightward. • When supply decreases, • QS decreases at each and every price • supply curve shifts leftward.
Supply Change in supply vs. change in quantity supplied
Factors that change supply. • Prices of inputs • Prices of related goods produced • Substitutes in production • Complements in production • Expected future prices • Number of sellers • Taxes on Sellers • Technology
Market Equilibrium Equilibrium • situation in which opposing forces balance each other. • occurs when the price balances the plans of buyers and sellers. Equilibrium price • price at which the quantity demanded equals the quantity supplied. Equilibrium quantity • quantity bought and sold at the equilibrium price.
Market Equilibrium Price Adjustments If P>Pequil: • a surplus forces the price down. If P<Pequil: • a shortage forces the price up. At the equilibrium price, • QS=QD • and the price doesn’t change. S D
Predicting Changes in Price and Quantity • Illustrate Effect on Equilibrium Price and Quantity if: • Demand increases • Supply increases • Demand and supply simultaneously increase. • Practice with Supply/Demand to: • Predict effect of “shock” to market. • Understand the type of “shock” that might have caused an observed change in P & Q.
Price controls • A price ceiling is a maximum allowable price. • Results in a continuing shortage if ceiling is BELOW equilibrium price. • A price floor is a minimum allowable price. • Results in a continuing surplus if floor is ABOVE equilibrium price.