Lake Effect
Lake Effect. December 5, 2000. From a presentation by Greg Byrd (COMET program and former SUNY-Oneonta professor). Considering the number of people living on or near the Great Lakes, it is obvious that meteorologists must understand how lake effect happens.

Lake Effect
E N D
Presentation Transcript
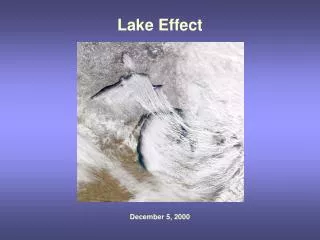
Lake Effect December 5, 2000
From a presentation by Greg Byrd (COMET program and former SUNY-Oneonta professor)
Considering the number of people living on or near the Great Lakes, it is obvious that meteorologists must understand how lake effect happens.
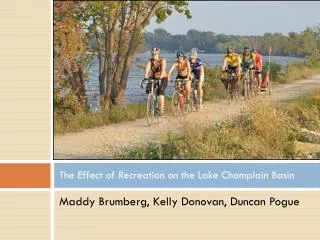
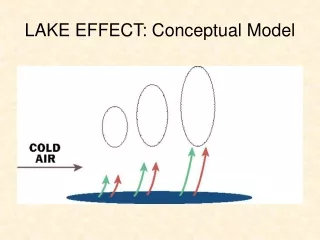
A Very basic schematic on the mechanics of lake effect snow.
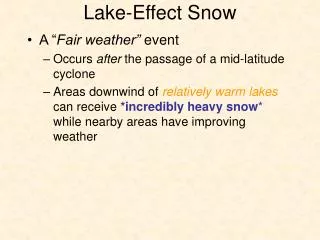
Lake Effect starts once the storm has passed between the Low and the incoming cold High.
Necessary conditions include cold air temperatures and winds flowing over the lake(s).
The lake water temperatures are much warmer than the air passing over.
Air passing over the lakes will have a very unstable layer to 850 mb.
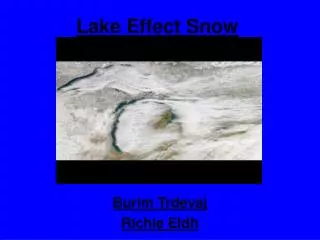
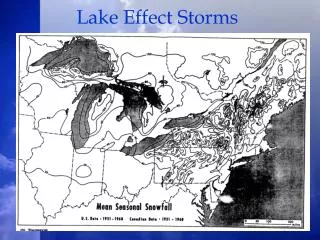
This is not all lake effect, but a lot of it is, even upwind of Lakes Ontario and Erie (downwind of Lake Huron and Georgian Bay)
Lake effect occurs with all the Great Lakes and many smaller lakes, too.
Observations for BINGHAMTON BROOME, NY (BGM) 1453Z 1 Dec 2003 to 1353Z 2 Dec 2003 STN TIME PMSL ALTM TMP DEW RH DIR SPD GUS VIS CLOUDS Weather MIN MAX P01 PCP DD/HHMM hPa inHg F F % deg kt kt mile F F in in ==== ======= ====== ====== === === === === === === ==== ======= ======= ======= ============ === === ==== ==== BGM 02/1353 1021.1 30.08 20 17 88 320 16 22 1 FEW009 BKN019 OVC025 S-F 0.00 BGM 02/1253 1020.3 30.06 20 18 92 300 10 1 X008 S-F 0.01 BGM 02/1153 1019.4 30.03 21 20 96 320 12 17 1/4 BKN003 OVC010 S+IF 21 25 0.02 0.03 BGM 02/1053 1018.4 30.00 22 18 84 270 13 22 3 BKN029 OVC060 S-F 0.00 BGM 02/0953 1018.3 30.01 23 17 78 280 12 10 FEW020 SCT044 OVC080 0.00 BGM 02/0853 1018.3 30.01 22 19 88 300 11 8 SCT018 BKN030 OVC090 S- 0.00 0.01 BGM 02/0753 1018.1 30.00 24 20 84 300 14 20 3 SCT017 BKN029 OVC070 S-F 0.01 BGM 02/0653 1016.9 29.97 25 17 71 280 16 23 10 BKN030 BGM 02/0553 1015.9 29.94 25 18 74 300 15 21 10 FEW023 SCT028 SCT033 24 26 0.00 0.00 BGM 02/0453 1016.2 29.95 25 22 88 270 10 9 FEW017 BKN023 OVC049 S- 0.00 BGM 02/0353 1016.2 29.95 25 24 96 270 12 1 SCT010 BKN016 OVC033 S-F 0.00 BGM 02/0253 1015.7 29.95 25 21 85 230 9 10 FEW030 BKN038 BKN070 BGM 02/0153 1016.6 29.97 24 20 84 230 8 10 CLR BGM 02/0053 1016.8 29.98 26 20 77 260 12 10 CLR BGM 01/2353 1016.9 29.98 26 22 84 270 11 18 10 SCT060 BKN080 25 34 0.00 0.01 BGM 01/2253 1016.1 29.96 25 24 96 270 11 3 SCT003 SCT012 BKN018 S-F 0.00 BGM 01/2153 1015.3 29.94 28 21 75 270 10 9 FEW027 BKN040 OVC060 0.00 BGM 01/2053 1014.2 29.91 30 19 63 280 11 21 10 FEW033 0.00 0.01 BGM 01/1953 1013.2 29.88 27 25 92 310 12 20 1/2 BKN006 BKN015 OVC037 SIF 0.00 BGM 01/1853 1012.3 29.85 28 27 96 300 14 35 1/4 SCT001 BKN018 BKN034 S+IF 0.01 BGM 01/1753 1011.1 29.82 33 20 58 300 14 24 10 BKN045 BKN050 30 38 0.02 BGM 01/1653 1011.0 29.82 32 23 69 290 16 25 10 FEW029 SCT070 0.00 BGM 01/1553 1010.9 29.81 30 30 100 310 15 30 1/4 SCT003 BKN015 BKN028 S+IF 0.02 BGM 01/1453 1009.4 29.77 38 24 57 280 17 21 10 SCT037 BKN045 Snow can be intense (S+) but the liquid equivalent is usually low
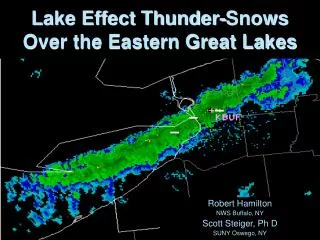
Lake Effect bands can be very long. On Jan 10, 2007, a band from Lake Ontario reached Connecticut and Massachusetts. This air probably had a fetch over Lake Huron before it reached Lake Ontario.
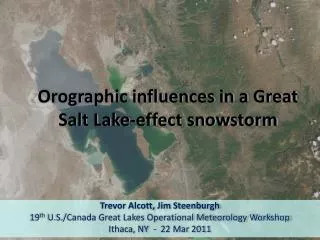
The water temperatures of Lakes Erie and Ontario can be very different due to their bathymetry. Lake Erie is a much more shallow lake than any of the other Great Lakes.
Shallow Lake Erie freezes over in late winter. None of the others do. When that happens, lake effect is greatly reduced.
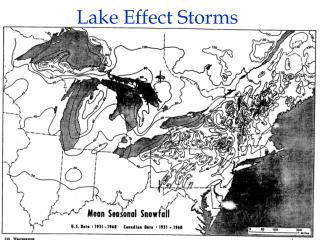
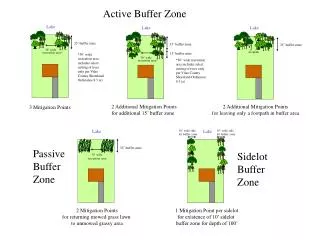
Fetches from north to south and west to east take air over higher terrain in NY state after leaving Lake Ontario. The extra upward vertical motion gives places like theTug Hill Plateau much heavier snowfalls. Tug Hill Plateau
Sfc-700 mb directional wind shear < 30 ° Sfc-700 mb directional wind shear >30 °
Jan 17, 2003. Strong dir wind shear, weak or nonexistent lake effect bands Dec 1, 2003. Weak dir wind shear, well developed lake effect bands
THROUGH 2002 OCT NOV DEC JAN FEB MAR APR MAY ANN BUFFALO, NY 0.3 11.4 24.3 24.0 17.7 12.5 3.2 0.2 93.6 SYRACUSE, NY 0.6 10.2 27.3 30.3 25.2 18.2 3.7 0.1 115.6 ROCHESTER, NY 0.2 7.5 19.7 23.5 21.8 15.8 3.5 0.3 92.3 Oneonta, NY 0.0 5.0 14.0 16.0 16.0 12.0 3.0 0.0 66.0 Buffalo, whose lake effect comes mainly from Lake Erie, starts strong but drops off sharply during February (not all snow in Buffalo is lake effect). Syracuse and Rochester which depend on Lake Ontario much more don’t show that dropoff.
The importance of a good lake effect snow forecast can’t be understated!