Download
1 / 33
380 likes | 710 Views
Watershed Geomorphology . 9/15 Agenda. Plot water balance components from each site Wrap-up similarity discussion Introduce project Watershed delineation with DEMs Hillslope erosional processes. Homework Due 9/19.

E N D
9/15 Agenda • Plot water balance components from each site • Wrap-up similarity discussion • Introduce project • Watershed delineation with DEMs • Hillslope erosional processes
Homework Due 9/19 • Obtain the values of annual Q, P, ET, and PET from each of the three watersheds. • Plot each watershed on a Budyko Curve (if possible) • Discuss similarities and differences in the annual water balance between the three sites.
Watershed Similarity • “Although the river and hillside do not resemble each other at first sight, they are only extreme members of a continuous series and when this generalization is appreciated one may fairly extend the river all over its asin and up to is very divde. Ordinarily treated, the river is like the veins of a leaf, broadly viewed it is the entire leaf.” (Davis, 1899) • Recognizes the continuous series and repeating patterns of networks • Implies infinite dissection, which is not likely true. • Distinct process thresholds in the landscape, which create distinct pattern breaks
Watershed Similarity • Multiple examples of self-similarity in watersheds • Patterns at one scale are repeated across “all” scales • Consider the koch curve: http://www.jimloy.com/fractals/koch.htm • And the self-similar tree
Watershed Similarity • Self-similar patterns exist throughout nature • Self-similar patterns exist throughout watersheds • Why? • Shreeve (1956) showed that random channel networks evolve to self-similar states • Rodriguez-Iturbe (199x) suggested that chance and the tendency to evolve to least-energy patterns leads to self-similarity • Once an “efficient” pattern is found, it repeats itself
Process and Pattern • Least energy patterns are non-unique • Channels and watersheds continually adjust their inputs • Dynamic equilibrium • A balanced state maintained by dynamic adjustments as fluctuations occur in the energy flow over the short term or as the system continuously changes its condition over the long term • Watersheds are open systems • Continuous flux of mass and energy
Open Systems • A continuous flux of mass and energy • In physics, open systems are self-regulatory • Adjust shape to minimize entropy, or least-energy expenditure • It is hypothesized that river channels adjust shape so that energy expenditure is minimized • Potential energy is converted to kinetic energy, dissipated as friction at the boundaries • Watersheds likely behave similarly • Responsible for self-similar patterns
Patterns in Fluvial Geomorph • Pools and riffles • sequence is approximately x times the river width • Self-adjusting mechanism to balance energy expenditure along a stream
Patterns in Fluvial Geomorph • Meandering • Langbein and Lepold 1966: Meandering pattern represents a least work tendency -Yang 1971: The meandering pattern expresses the constraints on a river so that ther is a least time rate of energy expenditure • Bedforms, braids, channel network…
The search for closure • Numerous attempts have been made to derive these “universal” properties by taking into consideration energy dissipation • Consider the hydraulic geometry problem
Watershed Similarity • Not as well established as fluvial similarity • 90’s hydrologic literature full of fractals • Promised to “solve” the runoff generation problem
Fractal Dimension • The exponent in a power law function that describes how objects change with scale • L = CA0.6 • Consider the dimensions • Line D=1 • Area D=2 • Volume D=3 • Fractal is somewhere in between
Dimension • Consider a square with a side length L=1
Dimension • Divide each side into 3 segments N = bD b = divisions D = dimension N = total segments 9 = 32
Dimension • D = 2 regardless of divider size N b D 3 2 4 2 25 5 2
Dimension • Lines, squares, and cubes are self-similar objects • We can break a line into x pieces and then magnify each pieces by x to obtain the original image N = bD LogN = DLogB D = (LogN)/(LogB) N is the number of self similar pieces B is a magnification factor
Fractal Dimension Replace each line with 4 lines, each with a length of 1/3 the original. This can be done infinitely, producing a line of infinite length. If you were to attempt to measure the length of this line, your result would depend on the size of the ruler. D = (LogN)/LogB)= Log4/log3 = 1.26 =log 16/log9= 1.26 =log64/log27 = 1.26 The Koch curve is self-similar in the 1.26 dimension
Fractals and Watersheds • An irregular geometric object with an infinite nesting of structure at all scales. • Many fractals have been identified in watershed geomorphology. • What does the existence of self-similar patterns and fractals mean for hydrology?
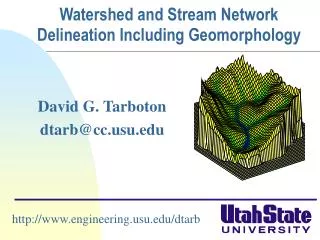
Watershed Delineation • Digital Elevation Models revolutionized geomorphologic AND hydrologic analysis • 1990’s literature full of “how to” papers describing methods to extract geomorphologic information from DEM’s • Commercial software companies grab free, unsupported code from papers • Commonly used programs • ArcGIS Hydrology tools - uses some out of date concepts, incomplete • TauDEM – Doesn’t work in ArcGIS 10, works from dos prompt • RiverTools – independent, expensive but works • Many hydrologic model packages have their own GIS programs • None do everything, user must have skill and knowledge
DEM Basics • A digital elevation model is a digital file containing x,y,z data (i.e. long, lat, elev) • 2 types of surface models – I will discuss the 2nd • TIN (triangular Irregular Network) • Irregularly spaced points linked to form a network of triangles • Raster • Regularly spaced grid of x,y,z
DEM Basics • A grid file in ascii formatspecificies • Arrangement of data • Corner coordinates • Resolution
DEM Basics • x,y,z numbers underlie the image
DEM basics • All GIS hydrology programs perform some common tasks • Fill pits • Compute slopes • Compute flow directions • Compute flow accumulation • Nearly all other operations are based on these Grids
DEM Basics • Basic operations produce information at each x,y including elevation, corrected elevation, slope, flow direction, flow accumulation • Many hydrologic and geomorphologic metrics are based on grids and features derived from above grids
DEM basics • Fill command “fills” false pits by adding elevation to terminal sinks 100 100 100 92 99 99 98 95 98
DEM Basics Slope in cardinal direction: S= (z1-z2)/resolution Slope in diagonal directions: S – (z1-z2)/(1.414*resolution) -can be reported in degrees, radians, ratio, pecent…
DEM Basics • Flow direction command assigns each pixel with a flow direction code
DEM Basics • Flow direction command assigns each pixel with a flow direction code • D8 method • 8 flow direction choices • Calculates slope to 8 possible neighbors • Assigns code in direction of steepest slope 8 4 2 1 16 100 100 100 128 4 32 What code would the red pixel receive? Any potential problems? 100 99 99 98 95 98
DEM Basics • Flow direction command assigns each pixel with a flow direction code • Dinf method • Allows flow to emerge from a point in any radial direction • Far superior, but not commonly implemented • See TauDEM: http://hydrology.usu.edu/taudem/taudem5.0/index.html
DEM Basics • Flow accumulation command calculates how many pixels flow through a point by connecting the flow direction arrows 128 4 32 What is the flow accumulation of the red pixel? If the resolution is 10m, what is the drainage area of the red pixel? 128 4 32 128 4 32 8 4 2 4 128 1 1 16 128 4 32
DEM Basics • Flow accumulation looks like a channel network, but it’s not
DEM Basics • Distinguishing hillslope flow paths from streams • Where do channels begin? • Most programs require user to enter a threshold drainage area • Importance for hydrology? • Not a straightforward problem • Errors in connectivity create stream errors