Download
1 / 9
90 likes | 195 Views
Key Performance Measures. 1993. 1998. 2002. Funds from Operations ($000s) Debt / Gross Asset Value Secured Debt / Gross Asset Value Interest Coverage Portfolio Summary: "A" Malls "B" Malls "C" Malls . $ 78,281 67.8 % 57.1 % 1.37 10 % 25 % 65 % . $ 206,670

E N D
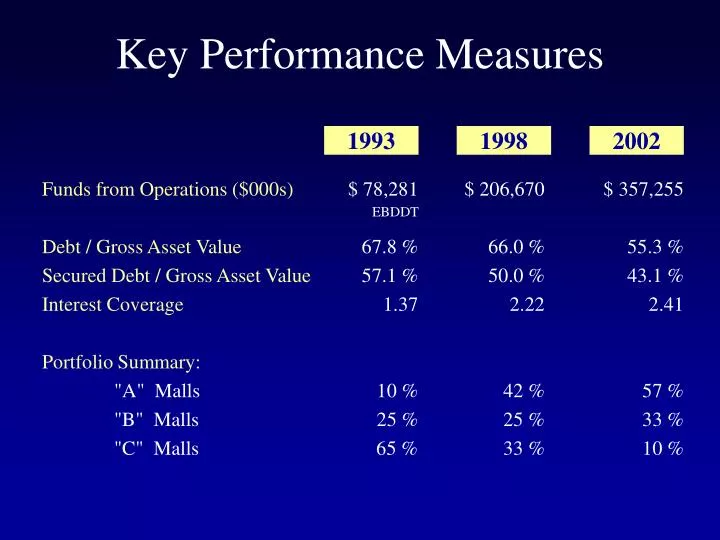
Key Performance Measures 1993 1998 2002 Funds from Operations ($000s) Debt / Gross Asset Value Secured Debt / Gross Asset Value Interest Coverage Portfolio Summary: "A" Malls "B" Malls "C" Malls $ 78,281 67.8 % 57.1 % 1.37 10 % 25 % 65 % $ 206,670 66.0 % 50.0 % 2.22 42 % 25 % 33 % $ 357,255 55.3 % 43.1 % 2.41 57 % 33 % 10 % EBDDT
2002 FinancingsAccessing $2.3 Billion in Capital Equity: Issuance of Common Equity 50% Partnership Interest Sold to JPMIM Secured Debt: C M B S Market Insurance Companies Bank Market - Existing Property Debt Bank Market - Construction Loans Unsecured Debt: Bond Market Bank Market - Acquisition Bridge Loan Increase in Line of Credit ($000s) $ 460,000 $ 68,000 $ 578,000 $ 25,000 $ 120,900 $ 140,000 $ 400,000 $ 392,500 $ 75,000
Debt Capital Markets I. Bond Market • REIT sector bonds outperformed “like rated”corporate bonds during 2002 • Investors demand for REIT bonds has increased due to: • Hard asset protection; • Covenant protections; and • Limited supply • Within the REIT sector, regional mall companies have outperformed the rest of the sector
Debt Capital MarketsLiquidity from Various Sources I. Bond Market II. Bank Market • The high-grade loan market remains very active and liquid • The investor pool has been transformed to include not only traditional commercial banks but many investment banks have materially stepped up their presence in syndicated lending
Debt Capital MarketsLiquidity from Various Sources I. Bond Market II. Bank Market III. CMBS Market • The appetite for high-quality product from CMBS lenders is very strong • $240 million financing on Oakbrook Center 5.1% ten year coupon
Secured Debt Unsecured Debt Balloon Maturities($000s) $643,948 $523,196 $471,773 $434,572 $341,595
Detail of 2003 Balloon Maturities($000s) $643,948 $242,690 Unsecured Debt Line of Credit - Option to Extend to 12/2004 $401,258 Secured Debt Non-Recourse Debt Guaranteed Construction Loan $ 331,186 $ 70,072 (One year extension option) 2003
Fixed Charges Fixed Rate Debt, Net, Ground Rent & Preferred Dividends Variable Rate Debt Swapped to Fixed Subtotal 81% 9% 90% Variable Component of Fixed Charges Fixed Rate Debt on Anticipated Financings Variable Rate Debt Subtotal 1% 9% 10% Summary of 2003 Fixed Charges