Download
1 / 21
210 likes | 225 Views
This study explores how gender affects specialization in recreational fishing among Massachusetts freshwater anglers. It compares male and female anglers, examining participation frequency, support for management tools, side-bet values, and the importance attached to activity-specific elements. The findings shed light on gender disparities in recreational fishing participation and preferences.

E N D
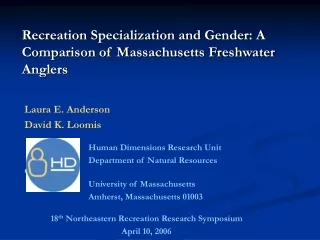
Recreation Specialization and Gender: A Comparison of Massachusetts Freshwater Anglers Laura E. Anderson David K. Loomis Human Dimensions Research Unit Department of Natural Resources Conservation University of Massachusetts Amherst, Massachusetts 01003 18th Northeastern Recreation Research Symposium April 10, 2006
Issue • Traditional fisheries management: male and resource oriented • Focus on biological and economic goals • Expert-client approach (i.e., “clients”= men) • Recent emphasis on using Human Dimensions research • Identify and understand stakeholders • Segment resource users into meaningful groups • Recreation Specialization • Segment users by skills, equipment, participation frequency • Women in recreational fishing • A minority in the activity, less studied than men • May experience the activity differently
Recreation Specialization • Defined using social worlds literature (Ditton et al., 1992) : • “a process by which recreation social worlds and subworlds segment and intersect into new recreation subworlds, and the subsequent ordered arrangement of these subworlds and their members along a continuum” • Specialization Index Development (Salz et al., 2001) • Social Subworlds Literature (Unruh, 1979) • orientation, experiences, relationships, and commitment
Recreation Specialization • Four propositions from Ditton et al. (1992) considered here: • As specialization increases, • participation frequency will likely increase • acceptance and support for rules, norms and procedures will likely increase • the value of side-bets will likely increase • importance of activity-specific elements will decrease relative to non activity-specific elements
Gender • Males predominate in recreational fishing • In U.S.: 74% male (DOI, 2001, p. 15) • Leisure quantity and quality(Mattingly and Bianchi, 2003) • Contaminated leisure • Interrupted leisure • Impact of children • Gender constraints • Ethic of care (Jackson and Scott, 1999) • 76 cent income gap (U.S. Census, 2005) • Social isolation and skill (Jackson and Henderson, 1995) • Social norms and expectations • Women may be less specialized in recreational fishing
Hypotheses • Specialization distribution: • Ha1: Male anglers will be more highly specialized than female anglers • Fishing frequency: • Ha2: High-specialization and male anglers will have a greater frequency of participation than will low-specialization and female anglers • Management items: • Ha3: High-specialization and male anglers will have greater support for various management tools and regulations than will low-specialization and female anglers
Hypotheses • Side bet items: • Ha4: High-specialization and male anglers will have generated a greater value of side-bets than will low-specialization and female anglers • Activity-specific elements: • Ha5: High-specialization and male anglers will attach less importance to activity-specific elements of the fishing experience than will low-specialization and female anglers • Non activity-specific elements: • Ha6: High-specialization and male anglers will attach more importance to non activity-specific elements of the fishing experience than will low-specialization and female anglers
Methods • Data Collection • 1998 survey of 2,930 Massachusetts freshwater anglers • mail questionnaire using Salant and Dillman Total Design Method • Specialization Index (Salz et al., 2001) • four specialization levels • Initial sample……………………………….. 2,930 -- • Mortality………..……………………………. 344 -- • Effective sample………..………………….. 2,586 100.0 • Nonresponse………..……………………… 1,175 45.4 • Useable returned surveys………...…………. 1,41154.6 Response Rate N %
Methods • Sample • Useable returned surveys………...……………….. 1,41154.6 • Total females……….……………………………… 151 10.7 • Total males………………………………………. 1,238 87.7 • Selected females and males and • specialization level indicated • (level 2, 3, or 4)…………………………………… 281 19.9 • Females………………................136 • Males………………....................145 N % • Data Analysis • Chi square test for differences in specialization level distribution between male and female anglers • Two way ANOVA using “gender” and “specialization level” as factors • 0.10 level of significance (Gregoire and Driver, 1987)
Hypotheses Testing: Ha1 X2 = 0.020
Hypotheses Testing: Ha 2 Frequency of Participation Years fishing…….………………...21.9227.20 26.87 2.333 0.099 Days fishing..……………………...15.0733.6250.75 23.476 0.000 Level of specialization ItemsLow Medium High F p Gender Years fishing…….………………... 29.24520.395 15.644 0.000 Days fishing..……………………... 36.45021.101 7.501 0.007 Items Men Women F p
Hypotheses Testing: Ha3 Management Items Level of specialization Minimum size limit………………... 4.028 4.0264.589 5.329 0.005 _______________________________________________________________ Maximum size……………………... 3.467 3.650 3.839 2.005 0.137 Creel limit………………………….. 4.143 4.198 4.500 1.860 0.158 Slot limit…………………………… 3.235 3.241 3.527 1.314 0.271 Stock native fish…………………… 4.243 4.302 4.455 1.481 0.229 Mandatory catch and release……… 3.124 3.284 3.429 0.813 0.445 Prohibit use of certain gear ……….. 3.621 3.573 3.786 0.589 0.556 No stocking allowed……………….. 3.724 3.629 3.821 0.470 0.625 Stock non-native fish……………… 2.933 3.017 3.109 0.537 0.585 Voluntary catch and release ………. 4.028 4.077 4.125 0.247 0.781 Restricted fishing area…………….. 3.394 3.422 3.304 0.151 0.860 ItemsLow Medium High F p
Hypotheses Testing: Ha3 Management Items Gender Restricted fishing area……………………3.1353.628 9.308 0.003 ___________________________________________________________ Mandatory catch and release …………... 3.358 3.142 1.408 0.236 Creel limit………………………………. 4.277 4.161 1.286 0.258 Prohibit use of certain gear…………….. 3.550 3.685 1.030 0.311 Stock non-native fish…………………… 3.048 2.938 0.010 0.920 Stock native fish………………………... 4.320 4.267 0.031 0.861 Minimum size limit…………………….. 4.176 4.100 0.116 0.734 Voluntary catch and release …………… 4.047 4.087 0.161 0.689 No stocking allowed……………………. 3.705 3.673 0.003 0.958 Maximum size………………………….. 3.604 3.624 0.053 0.818 Slot limit………………………………... 3.295 3.293 0.167 0.683 ItemsMen Women F p
Hypotheses Testing: Ha 4Side Bet Items Level of specialization Replace reels……………….……...103.98252.92 380.37 10.958 0.000 Replace rods ……………………...103.29312.24 488.61 10.560 0.000 Replace tackle……………………..117.28333.55 510.28 9.612 0.000 ________________________________________________________________ Replace electronic equipment…….. 233.12 592.22 710.50 1.310 0.276 Gender Replace reels……………….……… 251.03 181.28 2.423 0.121 Replace tackle………………………307.93 255.66 0.379 0.538 Replace rods ……………………….272.79 257.42 0.089 0.766 Replace electronic equipment………567.95 490.95 0.000 0.992 ItemsLow Medium High F p ItemsMen Women F p
Hypotheses Testing: Ha5Activity-specific Items Level of specialization For the sport of fishing, not to obtain food to eat …………….. 3.443 3.7634.250 6.555 0.002 For the experience of the catch……. 3.491 3.8214.196 6.180 0.002 A fishing trip can be successful even if no fish are caught………... 3.785 3.8034.196 3.746 0.025** _______________________________________________________________ I’m just as happy if I release the fish I catch…………………… 4.085 4.128 4.446 2.032 0.133 I’m just as happy if I don’t keep the fish I catch……………………4.009 4.162 4.339 1.768 0.173 When I go fishing, I’m just as happy if I don’t catch a fish …….. 3.105 3.197 3.375 2.040 0.132 To obtain fish for eating, and not for sport…………………. 1.651 1.500 1.643 0.738 0.479 ItemsLow Medium High F p
Hypotheses Testing: Ha5 Activity-specific Items Gender When I go fishing, I’m just as happy if I don’t catch a fish …………. 2.9873.430 11.733 0.001 A fishing trip can be successful even if no fish are caught ……………. 3.6674.053 6.544 0.011** For the experience of the catch…………. 3.9333.523 3.844 0.051 _____________________________________________________________________________________ To obtain fish for eating, and not for sport ……………………...1.517 1.596 1.488 0.224 For the sport of fishing, not to obtain food to eat …………………. 3.833 3.556 0.952 0.330 I’m just as happy if I don’t keep the fish I catch ………………… 4.181 4.080 0.849 0.358 I’m just as happy if I release the fish I catch ………………………. 4.159 4.182 0.054 0.816 ItemsMen Women F p
Hypotheses Testing: Ha6Non Activity-specific Items Level of specialization To experience adventure and excitement …………………. 3.5093.890 4.071 5.617 0.004 To be close to the water …………... 3.606 3.718 4.107 3.845 0.023 To experience natural surroundings ……………………. 4.271 4.2484.589 3.223 0.041 To experience new and different things …………………. 3.019 3.1193.491 4.081 0.018 _____________________________________________________________________________________________________________________________ To be outdoors…………………….. 4.280 4.222 4.536 1.871 0.156 For family recreation………………. 3.654 3.362 3.286 1.280 0.280 To get away from the demands of other people ………... 3.676 3.504 3.946 1.703 0.184 To be with friends…………………. 3.374 3.241 3.564 1.210 0.300 To get away from the regular routine ………………….. 3.915 3.941 4.145 0.715 0.490 For relaxation……………………… 4.385 4.314 4.464 0.504 0.605 ItemsLow Medium High F p
Hypotheses Testing: Ha6Non Activity-specific Items Gender For family recreation…………………… 3.1973.700 6.070 0.014 To experience new and different things ……………………….3.0143.227 4.312 0.039 ____________________________________________________________ To be close to the water ………………... 3.649 3.800 1.846 0.175 To be with friends………………………. 3.230 3.400 1.710 0.192 To experience natural surroundings …… 4.219 4.380 1.445 0.230 To get away from the demands of other people …………….. 3.534 3.722 1.018 0.314 To get away from the regular routine ….. 3.860 4.033 0.968 0.326 For relaxation…………………………... 4.280 4.369 0.653 0.420 To be outdoors………………………….. 4.219 4.356 0.322 0.571 To experience adventure and excitement ………………………. 3.780 3.715 0.277 0.599 ItemsMen Women F p
Discussion and Conclusions • Women comprise a small percentage of Massachusetts freshwater anglers • 10% of survey sample • Social norms and expectations? • Other constraints (leisure quantity and quality, ethic of care) • Recreation specialization somewhat supported • Propositions strongly supported in Salz et al. (2001) • Limitations of smaller sample size; reduced power • Means generally varied in expected direction • Men rated more highly on Specialization Index than women • However, few differences found on items tested
Discussion and Conclusions • Differences found between female and male anglers: • As expected: • Participation Frequency • Men fished an average of 15 days more per year than women • Men fished an average of 9 years longer than women • Men considered experience of catch more important • Not as expected: • Women placed less importance on catching fish than men • Family recreation and experiencing new and different things more important to women • Women more supportive of restricted fishing area
Conclusions • Men rated more highly on Specialization Index than women, • …yet women varied little in motivations, management support, and side-bets compared to men • Clear difference in participation frequency and years of participation • Exploratory analysis suggests more study of gender and specialization needed