Download
1 / 1
10 likes | 133 Views
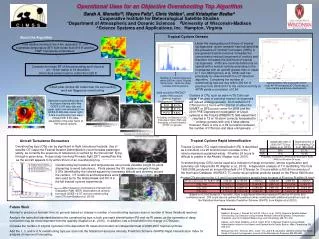
Applications Of A Satellite-Based Objective Overshooting Convective Cloud Top Detection Product Kristopher Bedka 1 , C. Wang 1 , R. Dworak 2 , W. Feltz 2 , and L. Carey 3 1 Science Systems and Applications, Inc . @ NASA Langley Research Center, Hampton, VA

E N D
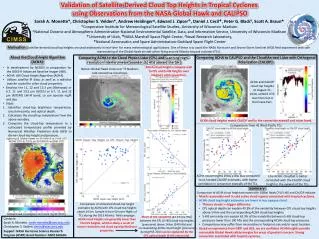
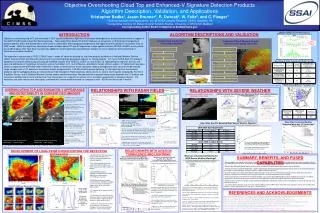
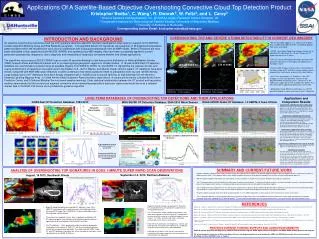
Applications Of A Satellite-Based Objective Overshooting Convective Cloud Top Detection Product Kristopher Bedka1,C. Wang1,R. Dworak2, W. Feltz2, and L. Carey3 1 Science Systems and Applications, Inc. @ NASA Langley Research Center, Hampton, VA 2 Cooperative Institute for Meteorological Satellite Studies, University of Wisconsin-Madison 3 University of Alabama in Huntsville Corresponding Author Email: kristopher.m.bedka@nasa.gov OT Stratospheric Cirrus Plume Shadow ENTLN Data Outage OVERSHOOTING TOP AND SEVERE STORM DETECTABILITY IN CURRENT GEO IMAGERY INTRODUCTION AND BACKGROUND An objective overshooting convective cloud top (OT) signature detection algorithm has been developed in recent years in support of the GOES-R Aviation Algorithm Working Group and Risk Reduction programs. This algorithm detects OT signatures via recognition of IR brightness temperature patterns present within the thunderstorm anvil cloud in combination with tropopause temperature from an NWP model. While OT features are most easily detectable in high spatial resolution MODIS, AVHRR, and synthetic proxy ABI imagery, they have been successfully applied to current generation geostationary imagery for use in diagnosis and nowcasting of hazardous convective weather and climate applications. The algorithms can process a GOES CONUS scan in under 45 seconds allowing for real-time product distribution to National Weather Service (NWS) forecast offices and National Centers and for processing large geographic regions for climate studies. A 18-year GOES-East OT detection database has recently been produced using all available imagery from GOES-8, GOES-12, and GOES-13, highlighting the regional, diurnal, and seasonal distribution of hazardous convection across the Eastern U.S., Gulf of Mexico, and Atlantic Ocean offshore waters. OT detections have been directly compared with WSR-88D radar reflectivity to better understand how these signatures relate to precipitation echo top and rainfall intensity. Large sample sizes of OT detections have been directly compared with 1) NLDN cloud-to-ground lightning, 2) total lightning from the Northern Alabama Lightning Mapping Array, 3) United Airlines Eddy Dissipation Rate turbulence observations, 4) severe storm reports collected by the Storm Prediction Center, and 5) National Weather Service severe weather warnings. Clear statistical relationships between the OT product and hazardous weather demonstrate that this product can augment convective storm nowcasting especially in data-poor regions and would serve as a valuable interest field in the NSSL PHI severe storm probabilistic guidance algorithm. Wind • An OT most often appears as a small cluster of pixels that is significantly colder than the surrounding optically thick cirrus anvil cloud • GOES 1-min Super Rapid Scan imagery shows that an individual OT often exists for ≤ 5 mins, though an OT region can persist for 2+ hours • OTs are natural within deep convection, but those with prominent signatures in IR imagery are indicative of a hazardous storm • Current GEO imagery resolves only a small fraction of the total number of OT and other severe weather events, especially for small storms or early in the storm lifetime • An OT was found to be ~12 K colder in 1 km LEO imagery vs. 4 km GEO based on analysis of 425 MODIS/AVHRR and GOES events. Some OTs in the VIIRS case (upper-left) are 20 K colder than GOES. Thus OTs will harder to objectively detect with current GEO • Multispectral band difference techniques (i.e. WV-IR) provide ambiguous signals and inconsistent OT detection Hail Tornado 375 m VIIRS 5.5 km GOES-13 METEOSAT-9 SEVIRI OT Detections 2009/05/26 15 Min Imagery Willis Re Agricultural Crop Loss Ratio From Severe Hail (courtesy of Michael Kunz (KIT)) METEOSAT-8 SEVIRI OT Detections 2009/05/26 5 Min Imagery LONG-TERM DATABASES OF OVERSHOOTING TOP DETECTIONS AND THEIR APPLICATIONS Applications and Comparison Results GOES-East OT Detection Database: 1995-2012 NOAA AVHRR Global OT Database: 1-2 AM/PM, 6 Years Of Data MSG SEVIRI OT Detection Database: 2004-2010 Warm Season • QUANTITATIVE COMPARISONS WITH TURBULENCE • Turbulence frequency increases by 50% when aircraft fly within 5 km of an OT signature using 2005-2008 United Airlines in-situ EDR data. Severe turbulence was 10x more frequent at this radius relative to clouds with more spatially uniform IR BT. (Bedka et al. 2010) • QUANTITATIVE COMPARISONS WITH RADAR • Significantly increased heavy rainfall probability relative to clouds with more spatially uniform IR brightness temps via comparison with 2008 CONUS NEXRAD composite reflectivity mosaic data. (Bedkat el al. 2010) • 72% OT signatures have a composite reflectivity ≥ 55 dBZ. • OT detection false alarm rate ranges from 6-17% via NEXRAD and NASA CloudSat. (Bedke et al. 2012) • QUANTITATIVE COMPARISONS WITH LIGHTNING • Cloud-to-ground lightning is 2x more likely to occur within 10 km of an OT detection versus a cold pixel in a more uniform IR BT field using 2009 NLDN data. The OT-CG lightning relationship increases significantly with decreasing IR BT. • The total lightning flash rate peaks ~3 mins before OT detection via comparison of Northern Alabama LMA flashes with 1606 GOES OT events • QUANTITATIVE COMPARISONS WITH SEVERE WEATHER • OTs were detected near 55% of severe weather events over CONUS from 2004-2009 (Dworak et al. 2012) • RESEARCH APPLICATIONS • Use back-tracjectories with OT detection information to determine the link between stratospheric WV observed by in-situ aircraft and satellite-observed deeo convection • Use OT detections to improve cloud-top height retrievals in the NASA LaRC CERES MODIS cloud algorithm and a 30-year AVHRR Climate Data Record produced at NASA LaRC • Use OT detections with measurements of OT-induced shadows from MSG SEVIRI and NOAA-17 AVHRR to estimate OT penetration height (Kanak et al. 2012) 2004-2009 Warm Season Diurnal Cycle of GOES vs MSG SEVIRI OT Activity GOES-East Monthly OT Detections No discernable increase in OT activity over the 17 year period Interannnual variability has become more pronounced with a 3-4 year periodicity in OT maxima SUMMARY AND CURRENT/FUTURE WORK ANALYSIS OF OVERSHOOTING TOP SIGNATURES IN GOES 1-MINUTE SUPER RAPID SCAN OBSERVATIONS • Rigorous validation and comparison studies like those shown here indicate that the GOES-R OT detection algorithm pinpoints where hazardous weather is likely occurring within a deep convective storm. These products offer a more reliable hazardous convective storm detection capability than any other existing satellite-based algorithm • With the improved GOES-R ABI spatial (4x) and temporal (3x-30x) resolution, we expect the OT signature detection rate to improve significantly • The OT detection output is well correlated with multiple types of weather-related hazards, 1) improving situational awareness of a storm’s possible severity or turbulence potential in data-rich land regions and 2) acting as a valuable warning or advisory decision aid over data-poor land and ocean regions • The OT product will nicely complement the very frequent but relatively coarse spatial resolution GOES-R GLM observations, identifying small convective cores without lightning but also allowing for a wealth of basic research into the relationship between satellite-inferred updraft characteristics and storm electrification • We plan to identify a tornadic storm event observed during GOES-14 1-min SRSO and perform a similar analysis to the hail/wind cases shown on this poster • The OT detection algorithm is currently being improved via inclusion of visible channel texture and additional IR interest fields within a more sophisticated pattern recognition framework to generate a probabilistic OT detection product. This has significant advantages over the current product that is a yes/no binary mask with fixed detection criteria. September 2-3, 2012. Northern Alabama August, 16 2012, Southwest Illinois GOES-14 10.7 μm IR: 2012/09/02 at 2348 UTC GOES-14 Visible: 2012/09/02 at 2348 UTC OT Tracked In Time Series Shadow Length = 30 km OT Penetration = 1.7 km Equilibrium Level = 16.2 km Cloud Top Height = 17.9 km REFERENCES • Rapid IR cloud top cooling and repeated OT detections from 2330–2348 UTC correspond with a rapid increase in total lightning activity. • Rapid IR cloud top cooling and repeated OT detections from 1915–2000 UTC correspond with a rapid increase in total lightning activity. Missing GOES images from 1940-2015 UTC prevent detailed analysis when lighning actitvity peaked • 2.5 inch hail was reported 15-mins after a significant oscillation in IR BT, indicating updraft intensification which aided hail growth and then updraft decay which allowed the hail to fall to the surface Bedka, K. M., J. Brunner, R. Dworak, W. Feltz, J. Otkin, and T. Greenwald, 2010: Objective satellite-based overshooting top detection using infrared window channel brightness temperature gradients. J. Appl. Meteor. And Climatol., 49, 181-202. Bedka, K. M., 2011: Overshooting cloud top detections using MSG SEVIRI infrared brightness temperatures and their relationship to severe weather over Europe. Atmos. Res., 99, 175-189. Bedka, K. M., J. Brunner, and W. Feltz, 2011: Objective overshooting top and enhanced-V signature detection for the GOES-R Advanced Baseline Imager: Algorithm Theoretical Basis Document. Bedka, K. M., R. Dworak, J. Brunner, and W. Feltz, 2012: Validation of satellite-based objective overshooting cloud top detection methods using CloudSat Cloud Profiling Radar observations. J. Appl. Meteor. And Climatol. 51, 1811-1822. Dworak, R., K. M. Bedka, J. Brunner, and W. Feltz, 2012: Comparison between GOES-12 overshooting top detections, WSR-88D radar reflectivity, and severe storm reports. Wea. Forecasting. 27, 684-699 Kanak, J., K. M. Bedka, and A. Sokol, 2012: Mature convective storms and their overshooting tops over Central Europe: Overshooting top height analysis for summers 2009-2011. 2012 EUMETSAT Meteorological Satellite Conf., Sopot, Poland, 3-7 September 2012. Setvak, M. K. M. Bedka, D. T. Lindsey, A. Sokol, Z. Charvat, J. Stastka, P. K. Wang, 2013: A-Train observations of deep convective storm tops. Atmos. Res. 123, 229-248. PREVIOUS/CURRENT FUNDING SUPPORT AND ACKNOWLEDGEMENTS GOES-R Aviation Algorithm Working Group, GOES-R Risk Reduction Program, NASA Applied Sciences Program, and NOAA NCDC Climate Data Record Program We acknowledge the University of Wisconsin Space Science and Engineering Center for providing the GOES and SEVIRI data used in this research and for providing extensive McIDAS-X and –V support • VIL, OT height from visible shadow measurements, and radar echo top peak in the 2341-2348 UTC time period in conjunction with a maximum in reflectivity below 5 km (not shown). VIL, IR BT, and echo top show a secondary intensification at the time of severe wind. • Base reflectivity animation, time/height cross section, and echo top time series give some indication of a collapsing echo core near the time of the severe downdraft • Lightning activity peaks at the time of severe wind in association with charge separation from increased ice-ice collision within the downdraft. Severe Hail Report Location Severe Wind Report Location • An OT exhbited a ~1.6 km penetration height and actively produced a stratospheric cirrus plume at 2040 UTC, the time of minimum lightning activity but near peak echo top height. This shows that ABI SRSO visible, IR, and OTD detection information will still be valuable for hazardous storm identification in the GOES-R GLM era.