Download
1 / 31
320 likes | 467 Views
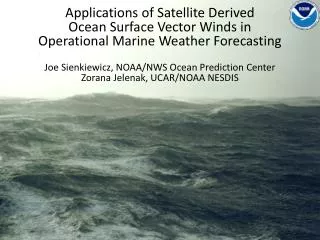
Applications of Satellite Derived Ocean Surface Vector Winds in Operational Marine Weather Forecasting Joe Sienkiewicz, NOAA/NWS Ocean Prediction Center Zorana Jelenak , UCAR/NOAA NESDIS. How is Wind Measured Over the Ocean ?. Direct Measurements. Buoy, Ships Pros

E N D
Applications of Satellite Derived Ocean Surface Vector Winds inOperational Marine Weather Forecasting Joe Sienkiewicz, NOAA/NWS Ocean Prediction Center ZoranaJelenak, UCAR/NOAA NESDIS
Direct Measurements • Buoy, Ships • Pros • Provide frequent updates at a single point, meeting or exceeding 1-hr refresh • Provide reference points for real-time diagnostics in the generation of the forecast/warning package • Complements synoptic scale satellite information by providing a frequently updated reference measurement • Cons • Limited coverage – only provide limited point measurements
Indirect Measurements ASCAT Descending Passes OSCAT Descending Passes Wind speed and direction information needs to be derived from satellite measurements
SeaSAT 1978 110 days Wind Vector Measurements Through History Ku-band QuikSCAT June 1999-Nov 2009 OceanSat-2 Sep 2009 NSCAT August 1996 Pencil-beam Scatterometer Stick Scatterometer Pencil-beam Scatterometer SeaWinds+AMSR Dec 2002 ERS 1 & 2 Aug 1991, April 1995 ASCAT Oct 2006 Stick Scatterometer Stick Scatterometer ASCAT-B Sep 2012 C-band
What are Scatterometers? • Microwave Radars on Polar orbiters • C-band ~5GHz (~5cm), Ku-band ~14GHz (~2cm) • C-band (less impacted by rain than Ku) • Ku-band(rain impact) • designed to measure ocean surface backscatter (s0 ) • Capillary waves • infer wind speed • Multiple samples from different azimuth angles • wind direction solutions
Pr Pt Surfaceroughnessrelatestos0anddepends on friction velocity
QuikSCAT Measurement Geometry WVC – Wind Vector Cell 25km → 76 WVC across swath 9
Measurement Geometry Far Swath Mid Swath Nadir Far Swath Mid Swath H-pol V-pol 2 observations 4 observations good azimuth diversity 4 observations poor azimuth diversity
4-Look Solution Most likely solution U=10m/s, χ=150°
Rain Effects • The radar signal is attenuated by the rain as it travels to and from the Earth’s surface σ0 • Retrieved wind speed The radar signal is scattered by the raindrops. Some of this scattered energy returns to the instrument σ0 • Retrieved wind speed • The roughness of the sea surface is increased because of the splashing due to raindrops σ0 • Retrieved wind speed • Directional information can be lost 13 16 December 2009
A S C A T T R A C K
O S C A T T R A C K
NOAA Ocean Prediction Center – scatterometer impacts on operations OSCAT and ASCAT Forecasters use every pass to: make warning and short-term forecast decisions and to estimate - cyclone location, intensity, extent of wind field - strength and extent of orographically enhanced jets - wind field near strong SST gradients Results in improved warning and forecast services over otherwise data sparse oceans