Download
1 / 35
360 likes | 494 Views
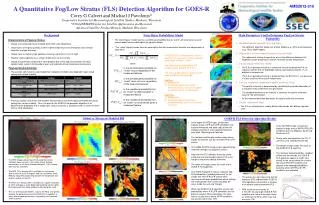
This product presents a new fog/low cloud detection algorithm that enhances aviation safety in Arctic regions with real-time monitoring. The algorithm utilizes satellite data to provide accurate cloud type, depth, and probability assessments in areas like Barrow, Deadhorse, and Kaktovik along the Arctic Ocean. Validation results demonstrate high accuracy in fog detection, with comparisons to surface observations and advanced instruments like CALIOP and SODAR. Continuous improvement efforts include incorporating additional data sources for better prediction capabilities.

E N D
Product Overview (Fog/Low Cloud Detection)
Arctic Ocean Areas of interest Barrow Deadhorse Kaktovik MVFR Probability
Arctic Ocean Barrow Surface observation at Barrow (in middle of an FLS deck) shows VFR conditions, while further east along the Arctic Ocean coast LIFR conditions are being reported Kaktovik Deadhorse
Barrow Notice how the traditional BTD FLS product would show the same signal (color) for both Barrow, Deadhorse, and Kaktovik Kaktovik Deadhorse
MVFR Probability Barrow The GOES-R MVFR probability product indicates a < 50% probability of MVFR at Barrow and a > 50% probability of MVFR at Deadhorse and Kaktovik. In general, the GOES-R product is more sensitive than the BTD to localized changes in ceiling. Kaktovik Deadhorse
Barrow Kaktovik Deadhorse The GOES-R FLS depth product shows that there is some spatial variability in cloud depth.
IFR Probability MVFR Probability FLS Depth Cloud Type
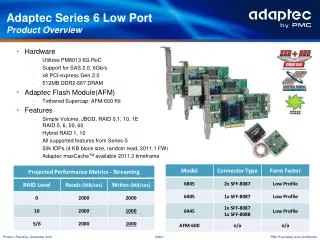
Requirements C – CONUS FD – FullDisk M - Mesoscale
Requirements C – CONUS FD – FullDisk M - Mesoscale
Validation Approach Validation sources: 1). Ceiling height at standard surface stations 2). CALIOP cloud boundaries 3). Special SODAR equipped stations 4). Fog focused field experiments Validation method: Determine fog detection accuracy as a function of MVFR probability; Directly validate fog depth
Surface Observation-Based Fog Detection Validation Comparisons to surface observations indicate that the 70% accuracy specification is being satisfied Peirces’s Skill Score Accuracy Day (0.51) Night (0.59) Combined (0.59) Day (75%) Night (83%) Combined (81%)
CALIOP-Based Fog Detection Validation Accuracy Comparisons to CALIOP indicate that the 70% accuracy specification is being satisfied Peirces’s Skill Score Daytime Accuracy: 90% Nighttime Accuracy: 91% Overall Accuracy 91% Overall skill: 0.61
SODAR-based Fog Depth Validation Comparisons with SODAR/ceilometer derived fog depth indicate a bias of ~30 m. More data points will be added to this analysis in the future. Daytime Nighttime
CALIOP-based Fog Depth Validation The GOES-R fog depth product was also compared to cloud depth information derived from CALIOP. A bias of -403 m was found.
FRAM-ICE RPOJECT SITEYellowknife, NWT, Canada INSTRUMENTS FD12P and Sentry Vis Tower 3 Tower 4 Tower 1 Tower 2
GOES-R Fog/Low Stratus Detection Over Yellowknife • This is a daytime scene covering the same area around Yellowknife, NWT and Great Slave Lake • The SW corner of this scene is shown to contain a large amount of thin, overlaying cirrus clouds (circled areas) • It should be noted that all the clouds in this scene were classified by the GOES-R cloud type algorithm as either mixed phase or ice clouds, which should be the case during an ice fog event Yellowknife Cirrus overlapping low clouds Yellowknife Yellowknife
Summary • The GOES-R ABI fog/low cloud detection algorithm provides a new capability for objective detection of hazardous aviation conditions created by fog/low clouds • The GOES-R AWG fog algorithm meets all performance and latency requirements. • Improved ABI spatial and temporal resolution will likely improve detection capabilities further. • Prospects for future improvement: 1). Incorporate additional NWP fields (e.g. wind). 2). Incorporate LEO data. 3). Working on incorporating “valleyness” metric derived from DEM 4). Correct for thin cirrus clouds 5). Work towards an all weather MVFR and IFR probability capability
Product Overview (SO2 Detection)
Example Product Output Cordon Caulle (Chile), June 06 2011 – 17:00
Example Product Output Grimsvotn, May 22, 2010 - 13:00 UTC OMI SO2 Product GOES-R SO2 Product Iceland The GOES-R and OMI products are in good agreement (more on this later) Iceland
Validation Approach • OMI is a Dutch-Finnish instrument on board the Aura satellite in NASA’s A-Train. • OMI uses measurements of backscattered solar UV radiation to detect SO2. OMI can detect SO2 at levels less than 1 DU. • Although OMI is very sensitive to SO2, it only views a given area of earth once daily. • The MODIS instrument on the Aqua satellite (also in the A-Train) observes the same area as OMI, which allows us to study any SO2 clouds observed by OMI. The Ozone Monitoring Instrument (OMI) is used as “truth” The ABI SO2 mask is validated as a function of OMI SO2 loading
Validation Approach Spurious data OMI SO2 Quality Flag (QF) from the OMI data set is used to filter out poor quality SO2 loading retrievals Before filtering After filtering
Validation Approach • The OMI SO2 loading product and the GOES-R proxy data (MODIS or SEVIRI) are matched up in time and re-mapped to the same grid to allow for quantitative comparisons.
SO2 Validation • The ABI SO2 mask is validated as a function of OMI SO2 loading. • Only scenes that contained SO2 clouds were used so this analysis reflects how the algorithm will perform in relevant situations • The accuracy is 79% when the OMI SO2 indicates 10 DU or more of SO2. Accuracy Accuracy Requirement
SO2 Validation • While not required the true skill score was also evaluated. • The true skill score is 0.59 when the OMI SO2 indicates 10 DU or more of SO2. • The true skill score is 0.70 when the OMI SO2 indicates 14 DU or more of SO2. True Skill Score
Summary • The ABI SO2 Detection algorithm provides a new capability to objectively detect SO2 clouds, which may be an aviation hazard and impact climate, at high temporal resolution (this is the first quantitative geostationary capability). • The GOES-R AWG SO2 algorithm meets all performance and latency requirements. • The improved spatial and temporal resolution of the ABI, along with a 7.3 um band that is better suited for SO2 detection, will likely lead to improved SO2 detection capabilities (relative to SEVIRI and MODIS). ABI channel 10 was specifically designed to help with SO2 detection (no SO2 product = wasted instrument capability) • Prospects for future improvement: 1). Express results as a probability, not a mask. 2). Correct for high level ice and ash clouds using bands not sensitive to SO2 3). Improve quantitative estimates of SO2 loading and possibly height