Operational Uses for an Objective Overshooting Top Algorithm
Operational Uses for an Objective Overshooting Top Algorithm Sarah A. Monette* # , Wayne Feltz*, Chris Velden*, and Kristopher Bedka^ Cooperative Institute for Meteorological Satellite Studies *Department of Atmospheric and Oceanic Sciences # University of Wisconsin-Madison

Operational Uses for an Objective Overshooting Top Algorithm
E N D
Presentation Transcript
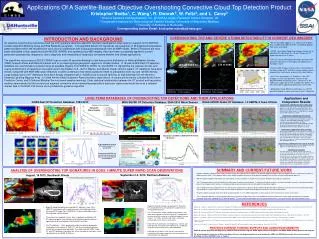
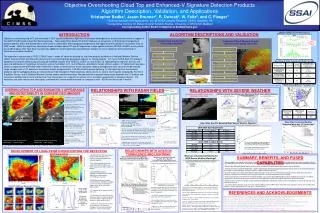
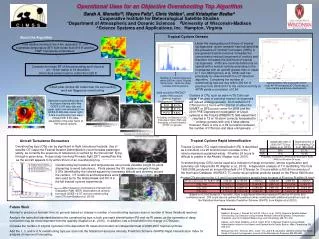
Operational Uses for an Objective Overshooting Top Algorithm Sarah A. Monette*#, Wayne Feltz*, Chris Velden*, and Kristopher Bedka^ Cooperative Institute for Meteorological Satellite Studies *Department of Atmospheric and Oceanic Sciences #University of Wisconsin-Madison ^Science Systems and Applications, Inc. Hampton, Virginia Tropical Cyclone Genesis About the Algorithm Under the marsupial pouch theory of tropical cyclogenesis, recent research has indicated that the presence of “vortical” hot towers (VHTs) in pre-genesis tropical cyclones increases the concentrated vertical component of vorticity and therefore increases the likelihood of tropical cyclogenesis. VHTs are currently defined as an updraft with a vertical velocity extending to the tropopause with an updraft greater than or equal to 1 m/s (Montgomery et al, 2006) and can potentially be observed with the OT detection algorithm. Comparing the number of overshooting tops per day within 200 km of pouches from 2009-2010 to the vertical vorticity at 40ºW yields a correlation of 0.54. Find relative minima in the 4 km resolution 11 μm brightness temperature (BT) field colder than 215 K and the NWP tropopause temperature Compute the mean BT of the surrounding anvil cloud at an ~12 km radius in 16 directions Anvil cloud pixels must be colder than 225 K Number of overshooting tops within 200 km of pre-Tropical Storm Colin. Note the sharp increase before genesis. Approximately 70% of pouches which cross 40º W averaging 30 OTs per day or more before experience development. Cloud pixel minima 9K colder than the surrounding anvil are flagged as overshooting 2009 and 2010 PREDICT cases “Will a pouch undergo tropical cyclogenesis” forecast. Clusters of OTs, such as seen in TS Colin can signal if an area of potential tropical cyclogenesis will indeed undergo genesis. An threshold of 5 OTs/scan for 2 hours within 200 km of either the UKMET or GFS pouch center for 2009 and the 2010 PRE-Depression Investigation of Cloud systems in the Tropics (PREDICT) field experiment resulted in 15 or 18 storm correctly forecasted to undergo genesis with only 4 false alarms. However, there is only a -0.39 correlation between the number of OTs/scan and days until genesis. Detected overshooting tops for Hurricane Katrina with 4km GOES-12 IR data (left and upper right) and simulated 2 km GOES-R ABI data (lower right). A few overshooting tops were missed with 4 km data, especially in the outer band of the tropical cyclone. Probability of Detection (POD), False Alarm Ratio (FAR) and Probability of False Detection (POFD) for genesis. 4 km GOES-12 IR data 4 km GOES-12 IR data Simulated 2 km GOES-R ABI data Aircraft Turbulence Encounters Overshooting tops (OTs) can be significant in-flight turbulence hazards. Use of satellite OT output the Federal Aviation Administration could increase passenger safety, as currently the presence of turbulence is verified by the first aircraft flying through a given area. A case study involving Pinnacle flight 2871 exemplifies this, Tropical Cyclone Rapid Intensification Tropical Cyclone (TC) rapid intensification (RI) is described as a minimum of a 25 knot/24 hours increase in the 1 minute maximum sustained winds. RI within 24 hours is difficult to predict in the Atlantic (Kaplan et al, 2010). Probability of Detection (POD) and False Alarm Ratio (FAR) for RI within 24 hours. as the aircraft appears to fly within 25 km of an overshooting top. Overshooting tops (OTs) can be used as a indication of deep convection, whose organization and symmetry can help predict RI (Kaplan et al., 2010). A dependant analysis of 111 landfalling TCs from 1995-2008, produced an exceed threshold of 4 OTs/scan for 2 hours within a 300-50 km annulus of the Hurricane Database (HURDAT) TC center as an optimal predictor based on the Pierce Skill Score. 25 km Overshooting top locations and temperatures can provide valuable insight for pilots attempting to avoid turbulence. Pilots aboard the GV airplane navigate through 5 OTs (identified by the colored square) by increasing altitude and diverting around the centers. OT locations and temperature were also used by for the Global Hawk and DC-8 in the fall tropical cyclone experiments. The frequency of turbulence inferred from Eddy Dissipation Rate (EDR) observations at varying distance from both GOES-12 OT and non-overshooting cold pixels (non-OT) from Bedka et al. (2010). Average OTs per scan for the 1, 3, and 6 hour periods before synoptic times for cases of RI and no RI within 24 hours. Based on a 2 tail Student’s T-test with, there is significant difference between RI and no-RI at the 95% confidence level. OTs could also be optimal RI predictors when combined with additional predictors such as the Statistical Hurricane Intensity Prediction Scheme (SHIPS) from Kaplan et al (2010). Future Work Attempt to produce a forecast time for genesis based on change in number of overshooting tops per scan or number of times threshold reached. Analyze the azimuthal standard deviation the overshooting tops in both yes-rapid intensification (RI) and no-RI cases, as the symmetry of deep convection may be more important than the quantity (Kaplan et al., 2010). In addition, test a threshold for the change in OTs/scan.. Increase the number of tropical cyclones in the dependent RI cases and conduct an independent test of 2006-2007 tropical cyclones. Add the 1, 3, and/or 6 hr overshooting tops per scan into the Statistical Hurricane Intensity Prediction Scheme (SHIPS)Rapid Intensification Index for analysis of improved forecasting. References Bedka K, Brunner J, Dworak R, Feltz W, Otkin J, et al. (2010) Objective Satellite-Based Overshooting Top Detection Using Infrared Window Channel Brightness Temperature Gradients. Journal of Applied Meteorology and Climatology: 49, 181–202. Kaplan, John, Mark DeMaria, John A. Knaff, 2010: A Revised Tropical Cyclone Rapid Intensification Index for the Atlantic and Eastern North Pacific Basins. Wea. Forecasting, 25, 220–241. Montgomery, M.T., Nicholls, M.E., Cram, T.A., and A.B. Saunders. (2006) A Vortical Hot Tower Route to Tropical Cyclogenesis. Journal of the Atmospheric Sciences: 63, 355-386.