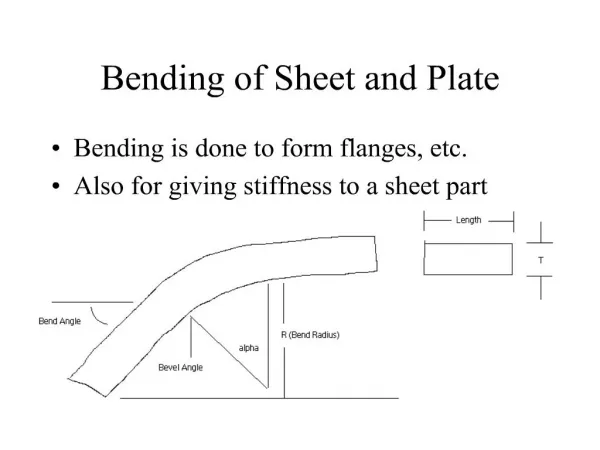
Download
1 / 23
240 likes | 312 Views
This progress report by Cheng Yu and Benjamin W. Schafer from Johns Hopkins University in February 2004 covers tests, notable findings, comparisons with local buckling tests and design codes, finite element modeling, and conclusions about C and Z member distortional buckling in bending.

E N D
DISTORTIONAL BUCKLING OF C AND Z MEMBERS IN BENDING Progress Report to AISI Cheng Yu, Benjamin W. Schafer The Johns Hopkins University February 2004
Overview • Test Summary • Notable Tests • Comparison with Local Buckling Tests • Comparison with Design Specifications • Finite Element Modeling • Conclusions
Notable Tests 1. Test D8C097 – with lower lateral-torsional buckling strength Local Distortional Lateral-torsional
Notable Tests - Continued Continued. Test D8C097 – with lower lateral-torsional buckling strength Actuator load-displacement D8C097-5E4W-standard D8C097-5E4W-angle added Actuator load P=10350 lbs Actuator load P=12751 lbs 84% of DSM_d 99% of DSM_d
Notable Tests - Continued 2. Test D8.5Z059-6E5W – failed outside constant moment region Purlin buckled Actuator load-displacement Beam failed at 83% of distortional strength by DSM
Notable Tests - Continued 3. Test D3.62C054-3E4W – failed by yielding Observed large deflection Mtest= 34 kips-in. My = 33 kips-in. McrD = 66 kips-in. (first mode)
Notable Tests - Continued 4. Test D8C033-1E2W – failed in local buckling mode Mtest= 32.8 kips-in. My = 40 kips-in. McrL = 30 kips-in. McrD = 61 kips-in.
Direct Comparison with Local Bucking Tests 9 pairs of tests having nominally identical geometry and material yield stresses
Direct Comparison with Local Bucking Tests - Continued Test 8.5Z092 Local buckling test Distortional buckling test Test 8.5Z082 Local buckling test Distortional buckling test
Direct Comparison with Local Bucking Tests - Continued Test 8C043 Local buckling test Distortional buckling test Test 12C068 Local buckling test Distortional buckling test
Comparison with Design Codes (consider controlling specimens only) Compared with North American Spec (NAS 2001) prediction Local buckling tests average Mtest/MNAS=1.02 Distortional buckling tests average Mtest/MNAS=0.87
Direct Strength Method vs. tests Local buckling tests Mtest/MDSL=1.03 Distortional buckling tests Mtest/MDSD=1.01* *formulas similar to AS/NZS Spec.
Finite Element Modeling displacement control at loading point. automatic stabilization technique applied.
Finite Element Modeling - Continued Shell element (S4R) Solid element (C3D8) Pin connection between Load beam and tube Tie connection between purlin and tube 1 Shell element (S4R) Tie connection between purlin and panel 2 1 2
Finite Element Modeling - Continued Link connection between two nodes to simulate the angle at tension flanges 3 • Material properties of beams use tension test results. • Panel is pure elastic. • High elastic modulus is assumed for tubesand load beam. 3 2
d d Type 1 Type 2 (local) (distortional) Finite Element Modeling – Continued geometric imperfection Geometric imperfection is generated by the superposing two eigenmodes which are calculated by finite strip method. The magnitudes are corresponding to 25% and 75% CDF of maximum imperfection. CDF of Maximum Imperfection
Finite Element Modeling – Continued comparison with tests
Finite Element Modeling – Continued selected results
Conclusions • Tests that separate local and distortional buckling are necessary for understanding bending strength • Current North American Specifications are adequate only for local buckling limit states • The Direct Strength expressions work well for strength in local and distortional buckling • Local buckling failure could control the strength of beams with loose restraint • Nonlinear finite element analysis with proper imperfections provides a good simulation • More work on restraint and influence of moment gradients has been initialized
Acknowledgments • Sponsors • MBMA and AISI • VP Buildings, Dietrich Design Group andClark Steel • People • Sam Phillips - undergraduate RA • Tim Ruth - undergraduate RA • Jack Spangler – technician • James Kelley – technician
Finite Element Modeling - Continued comparison with tests Local buckling tests Distortional buckling tests Ptest: tested actuator load P25%: load of simulation with 25% CDF P75%: load of simulation with 75% CDF
Comparison with Design Codes - Continued μ: meanσ: standard deviation
Test Summary Total 19 completed tests were included in the progress report. 9 Z beams 10 C beams Tensile tests are underway for additional performed 5 tests. D6C063-2E1W D8C045-1E2W D8C085-2E1W D10C048-1E2W D10C056-3E4W