Download
1 / 49
490 likes | 579 Views
This report provides updates on ocean conditions worldwide, including SST anomalies and ENSO patterns. Analysis covers the Pacific, Arctic, Indian, and Atlantic oceans, highlighting changes and predictions.

E N D
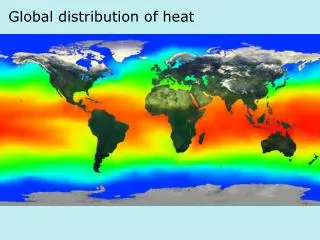
Global Ocean Monitoring: Recent Evolution, Current Status, and Predictions Prepared by Climate Prediction Center, NCEP/NOAA November 7, 2012 http://www.cpc.ncep.noaa.gov/products/GODAS/ This project to deliver real-time ocean monitoring products is implemented by CPC in cooperation with NOAA Ocean Climate Observation Program (OCO)
Outline • Overview • Recent highlights • Pacific/Arctic Ocean • Indian Ocean • Atlantic Ocean • Global SST Predictions
Overview • Pacific and Arctic Oceans • ENSO-neutral conditions continued during Oct 2012. • NCEP CFSv2 predicted weak below-normal SST in the winter 2012/13. • Negative PDO phase weakened substantially from -2.1 to -0.62 in Oct 2012, and NCEP CFSv2 predicted negative PDO phase would continue into next spring. • Arctic sea ice extent increased substantially in Oct 2012, and the Oct value was the second lowest in the satellite record above 2007. • Indian Ocean • Above-normal Indian Ocean Dipole conditions continued in Oct 2012. • Atlantic Ocean • Negative NAO phase strengthened with NAO=-1.73 in Oct 2012. The persistent negative NAO phase in the past 6 months contributed to strong warming in high-latitude N. Atlantic. • Above-normal SST persisted in the hurricane Main Development Region (MDR). • By Nov. 1, 19 named storms, 10 hurricanes and 1 major hurricane formed in the North Atlantic. The season is currently tied with 1887, 1995, 2010, and 2011 for the third most active Atlantic hurricane season in recorded history.
Global SST Anomaly (0C) and Anomaly Tendency • SST were near-normal in the central-eastern tropical Pacific. • Large positive SST anomalies presented in the Artic Ocean, subpolar North Atlantic, along the Gulf Stream, and near Japan. • Weak positive SST anomalies presented in the tropical North Atlantic and most of the Indian Ocean. • A cooling tendency presented in the east-central equatorial Pacific, west-central North Pacific and parts of the Arctic Ocean. • A warming tendency was observed near the west coast of North America. Fig. G1. Sea surface temperature anomalies (top) and anomaly tendency (bottom). Data are derived from the NCEP OI SST analysis, and anomalies are departures from the 1981-2010 base period means.
Longitude-Depth Temperature Anomaly and Anomaly Tendency in 2OS-2ON Fig. G3. Equatorial depth-longitude section of ocean temperature anomalies (top) and anomaly tendency (bottom). Data are derived from the NCEP's global ocean data assimilation system which assimilates oceanic observations into an oceanic GCM. Anomalies are departures from the 1981-2010 base period means. • Positive temperature anomalies continued to occupy near the thermocline in the equatorial Pacific Ocean. • Positive anomalies dominated at the upper 100m of equatorial Indian and Atlantic Ocean. • A cooling (warming) tendency was observed in the western and eastern (central) Pacific Ocean near the thermocline, largely due to propagation of downwelling oceanic Kelvin wave (see slide 11).
Evolution of Pacific NINO SST Indices • All Nino indices decreased except NINO 4. • NINO 3.4 was above 0.5oC in Jul-Sep 2012, which has a too short duration to meet El Nino definition. • The indices were calculated based on OISST. They may have some differences compared with those based on ERSST.v3b. Fig. P1a. Nino region indices, calculated as the area-averaged monthly mean sea surface temperature anomalies (oC) for the specified region. Data are derived from the NCEP OI SST analysis, and anomalies are departures from the 1981-2010 (bar) and last ten year (green line) means.
Last Three Month SST, OLR and 925hp Wind Anom. • Positive SST anomalies gradually weakened in the central-eastern equatorial Pacific from Aug to Oct 2012. • Atmospheric circulations were near-normal with strong intra-seasonal variability in the past three months.
Equatorial Pacific SST (ºC), HC300 (ºC), u850 (m/s) and OLR(W/m2 )Anomalies • Positive SSTA has weakened between 160W-120W while negative SSTA emerged east of 120W in late Sep 2012. • Positive HC300 anomalies strengthened in the central-eastern equatorial Pacific due to downwelling oceanic Kelvin waves. • Easterly wind anomalies emerged in the far western equatorial Pacific in late Oct 2012, which might be related to the cold anomaly forecast by NCEP CFSv2 model (see SST forecast section). Fig. P4. Time-longitude section of anomalous pentad sea surface temperature (left), upper 300m temperature average (heat content, middle-left), 850-mb zonal wind (U850, middle-right) averaged in 2OS-2ON and Outgoing Long-wave Radiation (OLR, right) averaged in 5OS-5ON. SST is derived from the NCEP OI SST, heat content from the NCEP's global ocean data assimilation system, U850 from the NCEP CDAS. Anomalies for SST, heat content and U850/OLR are departures from the 1981-2010 base period pentad means respectively.
Oceanic Kelvin Wave Indices • Upwelling oceanic Kelvin wave (dash line) emerged in mid-Aug in the W. Pacific and propagated eastward, contributing to the cooling tendency in the central-eastern tropical Pacific in Sep. • Downwelling oceanic Kelvin wave (solid line) emerged in mid-Sep in the W. Pacific and propagated eastward and reached near 150W in late Oct 2012, contributing to the warming tendency near 150W in Oct. • Oceanic Kelvin wave indices are defined as standardized projections of total anomalies onto the 14 patterns of Extended EOF 1 of equatorial temperature anomalies (Seo and Xue , GRL, 2005).
TAO GODAS Equatorial Pacific Temperature Anomaly • Positive temperature anomalies near the thermocline propagated eastward, consistent with downwelling oceanic Kelvin waves. • Compared to TAO, GODAS has slower propagation.
Status of TAO/TRITON Data Delivery http://www.ndbc.noaa.gov/ • The TAO/TRITON array has encountered significant outages, particularly in the eastern third of the array. Of the 22 TAO buoys along 95W, 110W, and 125W, only 10 are reporting in real time (David Legler, personal communication).
NINO3.4 Heat Budget • SSTA tendency (dT/dt) in NINO3.4 region (dotted black line) had increased since late Sep and became positive since mid-Oct 2012, indicating a warming in NINO3.4. • The increasing SSTA tendency is attributed to the increasing zonal advection (Qu) and thermodynamical term (Qq), which are probably related to MJO forcings and downwelling oceanic Kelvin wave. Huang, B., Y. Xue, X. Zhang, A. Kumar, and M. J. McPhaden, 2010 : The NCEP GODAS ocean analysis of the tropical Pacific mixed layer heat budget on seasonal to interannual time scales, J. Climate., 23, 4901-4925. Qu: Zonal advection; Qv: Meridional advection; Qw: Vertical entrainment; Qzz: Vertical diffusion Qq: (Qnet - Qpen + Qcorr)/ρcph; Qnet = SW + LW + LH +SH; Qpen: SW penetration; Qcorr: Flux correction due to relaxation to OI SST
2012 vs. 2011 Depth of 20C Isotherm Anomaly (m) TAO Aug 2011 Aug 2012 Sep 2012 Sep 2011 Oct 2012 Oct 2011 http://www.pmel.noaa.gov/tao/jsdisplay/ • In Aug-Oct 2012, D20 anomaly was weak and dominated by strong intra-seasonal variability related to MJO forcings; • While in Aug-Oct 2011, D20 anomaly was strongly negative, and dominated by low frequency variability, which was consistent with La Nina conditions in 2011/12.
Warm Water Volume (WWV) and NINO3.4 Anomalies Fig. P3. Phase diagram of Warm Water Volume (WWV) and NINO 3.4 SST anomalies. WWV is the average of depth of 20ºC in [120ºE-80ºW, 5ºS-5ºN] calculated with the NCEP's global ocean data assimilation system. Anomalies are departures from the 1981-2010 base period means. • WWV is defined as average of depth of 20ºC in [120ºE-80ºW, 5ºS-5ºN]. Statistically, peak correlation of Nino3 with WWV occurs at 7 month lag (Meinen and McPhaden, 2000). • Since WWV is intimately linked to ENSO variability (Wyrtki 1985; Jin 1997), it is useful to monitor ENSO in a phase space of WWV and NINO3.4 (Kessler 2002). • Increase (decrease) of WWV indicates recharge (discharge) of the equatorial oceanic heat content. 2010/11 La Nina 2011/12 La Nina OCT 2011 • Compared to 2011, the WWV recharge in early 2012 was slower and weaker , and the following discharge was delayed and slower. • However, the weaker WWV recharge in early 2012 was accompanied by a stronger SSTA growth, leading to NINO3.4 to exceed 0.5C in Jul-Sep 2012.
Pacific Decadal Oscillation Index • Negative PDO phase since May 2010 has persisted for 30 months now, and the PDO index weakened in Oct 2012 with PDO index = -0.62 • The apparent connection between NINO3.4 and PDO index suggest connections between tropics and extratropics. • However, the strengthening of negative phase of PDO since July 2012 seems not connected with the positive Nino3.4 SSTA. • Pacific Decadal Oscillation is defined as the 1st EOF of monthly ERSST v3b in the North Pacific for the period 1900-1993. PDO index is the standardized projection of the monthly SST anomalies onto the 1st EOF pattern. • The PDO index differs slightly from that of JISAO, which uses a blend of UKMET and OIv1 and OIv2 SST.
Subsurface Temperature Anom. in Central North Pacific • PDO has strong signature of subsurface temperature anomalies that can penetrate to below 300m. • Deep ocean warming in the central N. Pacific (160E-160W, 38N-42N) was particularly strong during the negative phases of PDO in 2009 and Jul 2010 – Oct 2012.
Last Three Month SST, SLP and 925hp Wind Anom. • Negative PDO-like pattern weakened substantially in Oct 2012. • The SST cooling in the central North Pacific was associated with negative SLP anomaly and anomalous cyclone in the region.
NorthAmerica Western Coastal Upwelling • Upwelling south of 45N was suppressed. Fig. NP2. Total (top) and anomalous (bottom) upwelling indices at the 15 standard locations for the western coast of North America. Upwelling indices are derived from the vertical velocity of the NCEP's global ocean data assimilation system, and are calculated as integrated vertical volume transport at 50 meter depth from each location to its nearest coast point (m3/s/100m coastline). Anomalies are departures from the 1981-2010 base period pentad means. • Area below (above) black line indicates climatological upwelling (downwelling) season. • Climatologically upwelling season progresses from March to July along the west coast of North America from 36ºN to 57ºN.
Monthly Chlorophyll Anomaly http://coastwatch.pfel.noaa.gov/FAST http • Negative Chlorophyll anomaly between 32N-42N was consistent with the weakened upwelling .
Arctic Sea Ice http://nsidc.org/arcticseaicenews/index.html. • Due to the rapid ice growth during October, Arctic sea ice extent for October 2012 was the second lowest in the satellite record, above 2007.
Evolution of Indian Ocean SST Indices • Warm (cold) temperature anomalies in the western (eastern) tropical Indian Ocean weakened in Oct 2012. • DMI was near 0.45o C in Oct 2012. Fig. I1a. Indian Ocean Dipole region indices, calculated as the area-averaged monthly mean sea surface temperature anomalies (OC) for the SETIO [90ºE-110ºE, 10ºS-0] and WTIO [50ºE-70ºE, 10ºS-10ºN] regions, and Dipole Mode Index, defined as differences between WTIO and SETIO. Data are derived from the NCEP OI SST analysis, and departures from the 1981-2010 base period means and the recent 10 year means are shown in bars and green lines.
Last Three Month SST, SLP and 925hp Wind Anom. • Positive SST anomalies shifted eastward and weakened from Aug to Oct 2012. • Associated with the warm SST anomalies were enhanced convection that shifted eastward with SST anomalies.
Evolution of Tropical Atlantic SST Indices Fig. A1a. Tropical Atlantic Variability region indices, calculated as the area-averaged monthly mean sea surface temperature anomalies (ºC) for the TNA [60ºW-30ºW, 5ºN-20ºN], TSA [30ºW-10ºE, 20ºS-0] and ATL3 [20ºW-0, 2.5ºS-2.5ºN] regions, and Meridional Gradient Index, defined as differences between TNA and TSA. Data are derived from the NCEP OI SST analysis, and departures from the 1981-2010 base period means and the recent 10 year means are shown in bars and green lines. • SSTA in the tropical North Atlantic (TNA) has increased continuously since Aug 2012. The positive SSTA in Oct 2012 is largely due to long-term trend. • Meridional Gradient Mode index (TNA-TSA) also increased continuously since Aug 2012. • ATL3 SSTA was near-normal since Jun 2012.
Tropical Atlantic: SST Anom., SST Anom. Tend., OLR, Sfc Rad, Sfc Flx, 925-mb/200-mb Winds • Above-normal SSTA persisted in the hurricane Main Development Region (MDR) . • Below-normal vertical wind shear presented in MDR. • Convection was enhanced over much of the tropical North Atlantic. • Westerly low-level wind blew towards the western Africa, indicating enhanced west African monsoon.
2012 Atlantic Hurricane Season (http://www.cpc.ncep.noaa.gov/products/outlooks/hurricane.shtml http://weather.unisys.com/hurricane/atlantic/2012/index.php http://en.wikipedia.org/wiki/2012_Atlantic_hurricane_season) • NOAA 2012 Atlantic Hurricane Outlook issued in August called for 12-17 named storms, 5-8 hurricanes and 2-3 major hurricanes. • By Nov. 1, 19 named storms, 10 hurricanes and 1 major hurricane formed in the North Atlantic. The season is currently tied with 1887, 1995, 2010, and 2011 for the third most active Atlantic hurricane season in recorded history.
North Atlantic U850 and U200-U850 • In the Hurricane Main Development Region (80W-20W, 10N-20N), westerly wind anomalies near the surface and below-normal vertical wind shear were observed in JJASO 2012, which is favorable for hurricane development. • The anomalies in JJASO 2012 were weaker than (similar to ) those in JJASO 2010 (2011).
NAO and SST Anomaly in North Atlantic Fig. NA2. Monthly standardized NAO index (top) derived from monthly standardized 500-mb height anomalies obtained from the NCEP CDAS in 20ºN-90ºN (http://www.cpc.ncep.noaa.gov). Time-Latitude section of SST anomalies averaged between 80ºW and 20ºW (bottom). SST are derived from the NCEP OI SST analysis, and anomalies are departures from the 1981-2010 base period means. • High-latitude North Atlantic SSTA is generally closely related to NAO index (negative NAO leads to SST warming and positive NAO leads to SST cooling). Negative NAO index has persisted over six months, contributing to the strong warming in the high- latitude N. Atlantic. • In the past three hurricane seasons, positive SSTA in MDR was strong in 2010, and became weakening in subsequent two years.
NCEP CFSv2 NINO3.4 Forecast CFSv1 was discontinued in September 2012 • The latest CFSv2 forecast suggests weak below-normal SST in the coming Northern Hemisphere winter.
IRI NINO3.4 Forecast Plum • Most of the models predicted ENSO-neutral and weak El Nino conditions in the coming Northern Hemisphere winter. • The consensus forecast favors ENSO-neutral conditions in the winter and next spring.
NCEP CFSv2 Tropical North Atlantic SST Forecast CFSv1 was discontinued in September 2012 denfield@earthlink.net • Latest CFSv2 prediction suggests tropical North Atlantic SST will cool down and return to normal-conditions in late winter and next spring. • The CFSv2 predicted the warming tendency quite well from Jan-Mar I.C..
NCEP CFSv2 Pacific Decadal Oscillation (PDO) Forecast PDO is the first EOF of monthly ERSSTv3b anomaly in the region of [110oE-100oW, 20oN-60oN]. CFS PDO index is the standardized projection of CFS SST forecast anomalies onto the PDO EOF pattern. - Latest CFSv2 prediction suggests weak negative PDO phase will persist through the coming winter and regain strength in next spring and summer.
Overview • Pacific and Arctic Oceans • ENSO-neutral conditions continued during Oct 2012. • NCEP CFSv2 predicted weak below-normal SST in the winter 2012/13. • Negative PDO phase weakened substantially from -2.1 to -0.62 in Oct 2012, and NCEP CFSv2 predicted negative PDO phase would continue into next spring. • Arctic sea ice extent increased substantially in Oct 2012, and the Oct value was the second lowest in the satellite record above 2007. • Indian Ocean • Above-normal Indian Ocean Dipole conditions continued in Oct 2012. • Atlantic Ocean • Negative NAO phase strengthened with NAO=-1.73 in Oct 2012. The persistent negative NAO phase in the past 6 months contributed to strong warming in high-latitude N. Atlantic. • Above-normal SST persisted in the hurricane Main Development Region (MDR). • By Nov. 1, 19 named storms, 10 hurricanes and 1 major hurricane formed in the North Atlantic. The season is currently tied with 1887, 1995, 2010, and 2011 for the third most active Atlantic hurricane season in recorded history.
North Atlantic: SST Anom., SST Anom. Tend., OLR, SLP, Sfc Rad, Sfc Flx • Large positive SSTA continued in the high-latitudes of North Atlantic Ocean. • The strong cooling tendency along the southeast coast was consistent with latent and sensible heat fluxes. Fig. NA1. Sea surface temperature (SST) anomalies (top-left), anomaly tendency (top-right), Outgoing Long-wave Radiation (OLR) anomalies (middle-left), sea surface pressure anomalies (middle-right), sum of net surface short- and long-wave radiation anomalies (bottom-left), sum of latent and sensible heat flux anomalies (bottom-right). SST are derived from the NCEP OI SST analysis, OLR from the NOAA 18 AVHRR IR window channel measurements by NESDIS, sea surface pressure and surface radiation and heat fluxes from the NCEP CDAS. Anomalies are departures from the 1979-1995 base period means except SST anomalies are computed with respect to the 1971-2000 base period means.
Tropical Pacific: SST Anom., SST Anom. Tend., OLR, Sfc Rad, Sfc Flx, 925-mb & 200-mb Winds Fig. P2. Sea surface temperature (SST) anomalies (top-left), anomaly tendency (top-right), Outgoing Long-wave Radiation (OLR) anomalies (middle-left), sum of net surface short- and long-wave radiation, latent and sensible heat flux anomalies (middle-right), 925-mb wind anomaly vector and its amplitude (bottom-left), 200-mb wind anomaly vector and its amplitude (bottom-right). SST are derived from the NCEP OI SST analysis, OLR from the NOAA 18 AVHRR IR window channel measurements by NESDIS, winds and surface radiation and heat fluxes from the NCEP CDAS. Anomalies are departures from the 1981-2010 base period means.
Evolution of Equatorial Pacific Surface Zonal Current Anomaly (cm/s) • Positive zonal current anomalies in the central-eastern equatorial Pacific switched to negative in early Sep 2012.
North Pacific & Arctic Ocean: SST Anom., SST Anom. Tend., OLR, SLP, Sfc Rad, Sfc Flx • PDO-like pattern presented in the North Pacific. • Positive SSTA in the Artic ocean further strengthened in August. • Large positive SW+LW anomalies were observed in the Artic ocean and the western North Pacific, leading to significant warming in these regions. Fig. NP1. Sea surface temperature (SST) anomalies (top-left), anomaly tendency (top-right), Outgoing Long-wave Radiation (OLR) anomalies (middle-left), sea surface pressure anomalies (middle-right), sum of net surface short- and long-wave radiation anomalies (bottom-left), sum of latent and sensible heat flux anomalies (bottom-right). SST are derived from the NCEP OI SST analysis, OLR from the NOAA 18 AVHRR IR window channel measurements by NESDIS, sea surface pressure and surface radiation and heat fluxes from the NCEP CDAS. Anomalies are departures from the 1981-2010 base period means.
Last Three Month SST Tendency and Surface Heat flux Anom. • SSTA tendency were generally consistent with surface heat flux anomalies, suggesting the importance of atmosphere forcing.
Tropical Indian: SST Anom., SST Anom. Tend., OLR, Sfc Rad, Sfc Flx, 925-mb & 200-mb Wind Anom. • Convection was enhanced (suppressed) in the western (eastern ) of the tropical Indian Ocean. • Southerly wind anomalies blew towards the India island. • SSTA tendency was largely consistent with surface heat flux anomalies. Fig. I2. Sea surface temperature (SST) anomalies (top-left), anomaly tendency (top-right), Outgoing Long-wave Radiation (OLR) anomalies (middle-left), sum of net surface short- and long-wave radiation, latent and sensible heat flux anomalies (middle-right), 925-mb wind anomaly vector and its amplitude (bottom-left), 200-mb wind anomaly vector and its amplitude (bottom-right). SST are derived from the NCEP OI SST analysis, OLR from the NOAA 18 AVHRR IR window channel measurements by NESDIS, winds and surface radiation and heat fluxes from the NCEP CDAS. Anomalies are departures from the 1981-2010 base period means.
NCEP CFS DMI SST Predictions from Different Initial Months Fig. M2. CFS Dipole Model Index (DMI) SST predictions from the latest 9 initial months. Displayed are 40 forecast members (brown) made four times per day initialized from the last 10 days of the initial month (labelled as IC=MonthYear) as well as ensemble mean (blue) and observations (black). The hindcast climatology for 1981-2006 was removed, and replaced by corresponding observation climatology for the same period. Anomalies were computed with respect to the 1981-2010 base period means. DMI = WTIO- SETIO SETIO = SST anomaly in [90oE-110oE, 10oS-0] WTIO = SST anomaly in [50oE-70oE, 10oS-10oN]
Switch to 1981-2010 Climatology • SST from 1971-2000 to 1981-2010 • Weekly OISST.v2, monthly ERSST.3b • Atmospheric fields from 1979-1995 to 1981-2010 • NCEP CDAS winds, sea level pressure, 200mb velocity potential, surface shortwave and longwave radiation, surface latent and sensible fluxes, relative humidity • Outgoing Long-wave Radiation • Oceanic fields from 1982-2004 to 1981-2010 • GODAS temperature, heat content, depth of 20oC, sea surface height, mixed layer depth, tropical cyclone heat potential, surface currents, upwelling • Satellite data climatology 1993-2005 unchanged • Aviso Altimetry Sea Surface Height • Ocean Surface Current Analyses – Realtime (OSCAR)
Be aware that new climatology (1981-2010) was applied since Jan 2011 1971-2000 SST Climatology (Xue et al. 2003): http://www.cpc.ncep.noaa.gov/products/predictions/30day/SSTs/sst_clim.htm 1981-2010 SST Climatology: http://origin.cpc.ncep.noaa.gov/products/people/yxue/sstclim/ • The seasonal mean SST in February-April (FMA) increased by more than 0.2oC over much of the Tropical Oceans and N. Atlantic, but decreased by more than 0.2oC in high-latitude N. Pacific, Gulf of Mexico and along the east coast of U.S. • Compared to FMA, the seasonal mean SST in August-October (ASO) has a stronger warming in the tropical N. Atlantic, N. Pacific and Arctic Ocean, and a weaker cooling in Gulf of Mexico and along the east coast of U.S.
Data Sources and References Please send your comments and suggestions to Yan.Xue@noaa.gov. Thanks! • Optimal Interpolation SST (OI SST) version 2 (Reynolds et al. 2002) • NCEP CDAS winds, surface radiation and heat fluxes • NESDIS Outgoing Long-wave Radiation • NDBC TAO data (http://tao.noaa.gov) • PMEL TAO equatorial temperature analysis • NCEP’s Global Ocean Data Assimilation System temperature, heat content, currents (Behringer and Xue 2004) • Aviso Altimetry Sea Surface Height • Ocean Surface Current Analyses – Realtime (OSCAR)