Download
1 / 43
440 likes | 803 Views
State Water Resources Control Board’s Methods to Estimate Streamflow and Water Availability. Julé Rizzardo Cal EPA Building, Sacramento May 1, 2002 * * Note: Slide 21 has been updated since the workshop to reflect the revised NMFS/DFG draft guidelines issued June 17, 2002.

E N D
State Water Resources Control Board’s Methods to Estimate Streamflow and Water Availability Julé Rizzardo Cal EPA Building, Sacramento May 1, 2002* * Note: Slide 21 has been updated since the workshop to reflect the revised NMFS/DFG draft guidelines issued June 17, 2002
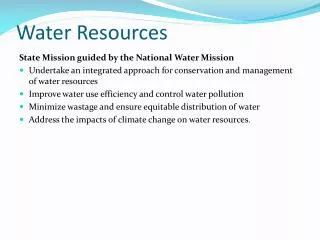
SWRCB’s New Approach to Comply with the Water Code • Purpose: To present the WAA requirements and methods to applicants, agents and public • Previously, Division staff has provided much technical services to the applicant • Shortage of technical staff & backlog of pending applications and change petitions • From now on, the Applicant is responsible for completing WAAs and Enviro Docs
Topics • Overview of California Water Rights • Hydrologic Data used by SWRCB staff • Estimating Demand using Water Rights Data • Estimating Supply (Runoff) • Cumulative Flow Impairment Index (CFII) • Estimating Bypass Flow • Evaluation & Improvement of Methods
Water in California • 103 Rivers • 5000 Lakes • 1840 Miles of Shoreline • 460 Groundwater Basins • 700 “Major” Reservoirs • 37,000 Water Rights
Major Types of Water Rights • Riparian • Property must abut the source stream • Rights are correlative • Pre-1914 Appropriative • For diversion of water on parcels that do not abut a stream • Right must have been initiated before December 19, 1914
Major Types of Water Rights, cont. • Post-1914 Appropriative • For any storage of water, regardless of whether the parcels abut a stream • For direct diversion of water on land that does not abut a stream • Initiated after December 19, 1914 • Other Post-1914 Water Rights • Stockwatering Certificates • Small Domestic Registration • Small Livestock Registration
General Water Right Priorities • 1) Riparian • 2) Appropriative “First in Time -- First in Right” • Pre-1914 • Post-1914
Permit Required • Post-1914 Appropriative Water Rights • Stockwatering Certificates • Small Domestic Registration • Small Livestock Registration
Permit Not Required • Use of purchased water • Percolating groundwater • Riparian right (Statement Required) • Pre-1914 right (Statement Required) • Springs w/o natural outlet to stream
Precipitation Data • Streamflow may be unavailable or sparse • Difficult to find good precipitation data • Variability in rainfall w/ geography • Large source of error
Precipitation Data • HydroSphere CD’s compiled from National Climate Data Center (NCDC) • daily • monthly • yearly • WWW.HYDROSPHERE.COM/HDP
Hydrosphere CD - All Precipitation Stations in Mendocino County
Streamflow Data • USGS is main source of streamflow data • Discontinued gaging stations w/ short records • Watershed above gage may be impaired from diversions - hard to estimate unimpaired flow • Gage usually not located where you need the flow data, especially for “minor” projects • “Minor” - less than or equal to 200 acre-feet by storage or less than or equal to 3 cubic feet per second direct diversion
Streamflow Data Sources • Hydrosphere CD’s • WWW.HYDROSPHERE.COM/HDP • Historical daily USGS gage data • USGS Website • WATER.USGS.GOV/NWIS • Historical & provisional real-time data • CDEC Website • CDEC.WATER.CA.GOV • Historical & Provisional real-time data
Hydrosphere CD - All Streamflow Stations in Mendocino County
Using Streamflow Data 108,196 AF / 124,806 AF = 87% On avg, 87% of streamflow occurs between Oct 1 and Mar 31
Evaluating Projects: Points of Interest • NMFS and DFG are providing the location of points of interest for “coastal” watersheds based on their fishery resources information • Examples of Points of Interest • A project’s point of diversion • Where flow needs to be maintained for fishery resources (spawning, rearing, passage)
Points of Diversion Confluence Points of Interest Schematic
Cumulative Flow Impairment Index (CFII) • Estimated at a Point of Interest • Ratio of Demand to Supply • Used to determine the relative impairment of a watershed
Cumulative Flow Impairment Index (CFII) • Estimate on annual or seasonal basis. • For certain “North Coast” watersheds in the Counties of Mendocino, Sonoma, Marin and Napa, a season of Oct 1 to Mar 31 is used *. • October 1 - Beginning of water year when reservoirs start to fill. • March 31 - end of spawning, incubation, and outmigration period for anadromous fish ** *Since the May 1, 2003 workshop, NMFS has recommended a season of October 1 to March 31 for demand and December 15 to March 31 for supply * * 1997 SWRCB Russian River Division Staff Report
Estimating Water Demand • Use SWRCB’s Water Right Information Management System (WRIMS) Database • Use maximum diversion or storage (face value) listed in WRIMS of all known water rights above point(s) of interest • Download / verify WRIMS data by cross-referencing with (paper) water right files • If necessary, estimate seasonal demand from annual demand listed in WRIMS database
Water Rights Included in Demand • Statements of Water Diversion and Use for “Riparian” and “Pre-1914” Appropriators • Existing “Post-1914” water right applications • Small Domestic Registrations • Stockwatering Certificates • Small Livestock Registration • Other known authorized diversions • Pending water right applications
Demand Assumptions • Use maximum diversion and/or storage amount specified in Application or Permit until License is issued • Storage: Include domestic, irrigation, stockwatering, recreation, fish & wildlife uses, but not power • Direct Diversion: Include 10 days frost protection; do not include direct diversion for irrigation or power
Estimating Demand • Problem: The storage or direct diversion season is year-round or partially within the season of interest • Approach: Prorate the year-round or seasonal use to the season of interest, equally dividing the total use into the appropriate number of months, unless more detailed water use information is known
Estimating Demand • Problem: There is more than one pending application in the watershed above the point of interest • Approach: Estimate the demand for each pending application in the order of the application’s priority
Estimating Supply • Watershed-specific models: Russian River SSM (Streamflow Simulation Model) • Weekly • HEC-1 (Rainfall-Runoff) based • Rainfall - Runoff method • Adaptation of the Rational Method • Used to estimate average annual flow • Area-ratio streamflow method
Rainfall / Runoff Method • Q = c I A • c = runoff coefficient • I = precipitation (feet) • A = watershed area above point of interest (acres) • Q = runoff (acre-feet)
Rainfall-Runoff MethodStep 1: Find Runoff Coefficient (c) • Based on: • Relief • Soil type • Vegetal cover • Surface storage • Assign a value to each of the four categories above based on the Runoff Coefficient Table and sum them to get the runoff coefficient
Runoff Coefficient Table: Caltrans Highway Design Manual, 1995
Rainfall-Runoff MethodStep 2: Estimate Precipitation, I • Method 1: Use Precipitation Gage Data Directly • Use annual average rain gage data • Calculate seasonal rainfall from daily data in Excel spreadsheet • Method 2: Read Value from Isohyetal Map • SCS Soil Report (A report exists for each county) • WRIMS GIS rainfall coverage
Rainfall-Runoff MethodStep 3: Estimate Watershed Area, A • Measure Area Using Planimeter • For smaller watershed areas • For flat areas (like portions of Napa) • ArcView GIS • Efficient new tool • Zoom to appropriate scale • GIS cannot always find watershed boundary
Rainfall -Runoff Example:Estimate Average Annual Runoff • C = 0.50 • I = 48 in/yr = 4 ft/yr • A = 300 acres (area above point of interest) • Q = c * I * A = 0.50 * (4 ft/yr) * (300 acres) • Q = 600 acre-feet per year • To estimate seasonal flow from annual flow, multiply the annual flow by the % of flow that occurs in the season.
Area-Ratio Streamflow Method • Q = Qgage * (A/Agage) * (P/Pgage) • Q is the unknown flow at a point of interest • Qgage is the flow measured at the streamgage • A is the area above the point of interest • Agage is the area above the streamgage • Pgage is the precipitation above the streamgage • P is the precipitation above the point of interest
Known flow at gaging station, Q gage Known Area, Agage Known Precipitation, Pgage Area-Ratio Streamflow Method
Area-Ratio Streamflow Method • Estimate Area, A above point of interest • Estimate Precip. P • UNKNOWN FLOW, Q at point of interest
Estimating Bypass Flow • Instantaneous flow rate to be maintained past a project’s point of diversion • To protect fish habitat • To provide appropriate contributions to fish habitat downstream • Determined on a case-by-case basis
February Median Flow • NMFS, DFG and Division staff have recommended that a bypass equal to the February median flow be used in “North Coastal” watersheds • Mendocino County • Sonoma County • Marin County • Napa County
Estimating February Median Flow • The Median is the “middle value” of a set of data, not the average • Estimated using daily streamflow data
Estimating Flow: Limitations • Flow prediction difficult - small watersheds, intermittent streams, sparse hydrologic data • Lack of streamflow data suggests a regional regression approach
Evaluating and Improving Methodology • MBK Engineers peer reviewed SWRCB’s use of Q = CIA to estimate average annual flow • Current USGS contract work - evaluating SWRCB flow estimation in North Coast Region • Future USGS contract work - develop regional regression equations to estimate flow statistics