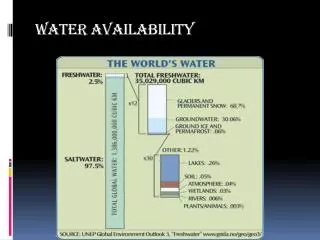
Water Availability
Water Availability. 1996 Texas drought Governor Bush asks “how much water do we have? How much are we using? How much do we need?” -- Ooops. No good answers! 1997 Senate Bill 1 passed by Legislature Regionalizes water planning in Texas and establishes surface water availability modeling

Water Availability
E N D
Presentation Transcript
Water Availability • 1996 Texas drought • Governor Bush asks “how much water do we have? How much are we using? How much do we need?” -- Ooops. No good answers! • 1997 Senate Bill 1 passed by Legislature • Regionalizes water planning in Texas and establishes surface water availability modeling • 2001 Senate Bill 2 passed by Legislature • Establishes groundwater availability modeling and initiates instream flow assessment
Improvements from Senate Bill 1:Water Modeling and Planning • Before Senate Bill 1, water planning was done state-wide by TWDB • SB1 established 14 water planning regional groups, who are now responsible for planning water supply in their area Water Availability Modeling (TNRCC)
1° 7.5' 7.5' Improvements from Senate Bill 1:Digital Map of Texas: 100K → 24K 1° Quadrangles 1:100,000 scale Approx. 100 maps cover Texas 1° 7.5' Quadrangles 1:24,000 scale 4400 maps cover Texas
Improvements from Senate Bill 1: Water Availability Modeling Sulphur Brazos Trinity 8000 water right locations Colorado 23 main river basins Rio Grande City of Austin Nueces Inform every permit holder of the degree of reliability of their withdrawal during drought conditions (TCEQ)
CRWR Mission for Senate Bill 1 • CRWR (UT Austin) aids in the response to Senate Bill 1 by providing to TNRCC watershed parameters defined from geospatial data for each water right location • These data are input by TCEQ contractors to a Water Rights Assessment Package (developed at TAMU) which determines the % chance that the water will actually be available at that location • TCEQ sends theownerof the water right a letter specifying the availability of water
Water Rights in the Sulphur Basin Water right location Stream gage location Drainage areas delineated from Digital Elevation Models are used to estimate flow at water right locations based on flow at stream gage locations
90 72 95 76 85 80 75 90 83 89 81 73 72 83 85 80 82 70 89 87 Digital Elevation Model 75 77 79 85 92
Topographic Map of West Austin1:24,000 scale Hog Pen Ck 4 km 4 km
Digital Elevation Model (DEM) 720 720 Contours 740 720 700 680 740 720 700 680
Cell Size 30m 100m
32 64 128 16 1 8 4 2 Eight Direction Pour Point Model Water flows in the direction ofsteepest descent
32 64 128 16 1 8 4 2 Flow Direction Grid
Stream cell Cell to Cell Grid Network Through the Landscape
Comparison of Drainage Areas DEM Difference is ~ 0.5% USGS
Watershed Properties Averaged over the Drainage Area + Property grid (CN or Precipitation) Drainage Areas
Connectivity of the Control Points Neches Basin This flow order is used in the Water Rights Analysis Package
Data Products GIS coverages for determining watershed parameters Watershed parameters as input for WRAP model = Analysis completed for more than 10,000 locations in all river basins of Texas
Ralph Wurbs ______________________________________ Professor and Division Head Environmental and Water Resources Division Department of Civil Engineering Texas A&M University College Station, Texas 77843 r-wurbs@tamu.edu (979)845-3079
Water Availability Modelingin TexasPursuant to 1997 Senate Bill 1 Water Rights Analysis Package (WRAP) model developed at Texas A&M University and adopted for Texas WAM System Water Availability Modeling (WAM) System implemented by TNRCC/TCEQ, its partner agencies, and contractors pursuant to Senate Bill 1 (SB1) enacted by the Texas Legislature in June 1997
Internet Sites • http://ceprofs.tamu.edu/rwurbs/ WRAP software and reference and users manuals • http://www.tnrcc.state.tx.us/permitting/ waterperm/wrpa/wam.html TCEQ Water Availability Models
Water Availability Modeling Process Historical Hydrology • Develop sequences of naturalized monthly flows for the period-of-analysis at selected gaging stations. • Distribute flows from gaged sites to ungaged sites. Current Water Management and Use • Simulate a specified scenario of water management/use during an assumed repetition of historical hydrology. • Develop measures of water supply reliability and water availability.
Water Rights Analysis Package (WRAP) • Generalized model for simulating management of rivers, reservoirs, and water use in a river basin or multiple-basin region under a priority-based water allocation system. • Tool for evaluating hydrologic and institutional water availability. • Set of Fortran computer programs.
Features of WRAP • Spatial configuration (control points) • Hydrologic period-of-analysis • Natural hydrology • Water management and use • Water availability indices
Natural Hydrology • Naturalized flows at gaged sites • Flow distribution to ungaged sites • Channel losses • Net reservoir evaporation-precipitation
Water Management and Use • Water right priorities • Water supply diversions • Return flows • Reservoirs • Multi-reservoir system operations • Off-channel reservoirs • Interbasin transfers • Instream flow requirements • Hydroelectric power
Water Availability Indices • Volume reliability • Period reliability • Frequency relationships for storage, regulated flows, and unappropriated flows
Current WRAP Development Efforts • Daily time step features • Conditional reliability model • Salinity tracking • Other Continuing refinements
Observations Regarding Texas WAM Project • Model development is an institutional partnership effort. • Many people contribute. • Regulatory and planning functions are integrally related. • A modeling system is constructed rather than just a model. • Data management is a governing concern. • Model development is a process of continual expanding and improving.