Exploring Planet Zog: Stars, Milkstains, and Fuzzballs in the Distant Sky
360 likes | 493 Views
Welcome to Planet Zog, a distant world with technology and physics mirroring our own, yet with a night sky unlike any other. Instead of the Milky Way, Zog features the Greater Milkstain, home to around ten million stars, and the lesser, fainter Lesser Milkstain. Recent observations have revealed mysterious jet-like fuzzy objects, called fuzzballs, scattered throughout the sky, showing varied brightness and sizes. Join Zoggian astronomers as they delve into this enigmatic celestial landscape, utilizing the Bubble Space Telescope to study these captivating phenomena.

Exploring Planet Zog: Stars, Milkstains, and Fuzzballs in the Distant Sky
E N D
Presentation Transcript
ASTR1001Planet Zog: Background Briefing and First Data Release
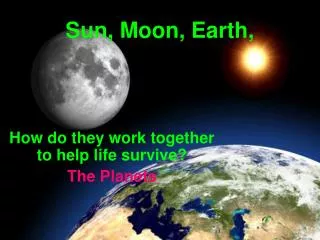
The Planet Zog • Imagine that you live on the distant planet Zog: far away in a space-time very different from our own. Zog is very much like the Earth: you have a technology virtually identical to our own. All the laws of Physics, as you measure them in the Zoggian laboratories, seem identical to the laws we measure on Earth. • The one thing that is very different is the night sky...
The stars look similar to Earth’s, but there is no Milky Way. Instead, north Zog astronomers see the awesome sight of the Greater Milkstain With its brilliant off-centre blue spot.
Southern hemisphere Zog astronomers see the equally brilliant southern blue spot. Recent Bubble Space Telescope observations have shown that the southern blue spot also has an off-centre milkstain associated with it. But the Southern Milk Stain is very very much smaller and fainter than its northern counterpart.
Celestial Coordinates. • The two blue spots are diametrically opposite on the sky (and hence can never both be seen at the same time, except by astronauts). • They are used as the origin of the celestial coordinate system: Declination: +90 for northern blue spot, 0 for the celestial equator. Both milkstains extend away from the two blue spots in the same direction (though the GMS extends further). Right Ascension: 0 to 360. Zero axis is along the long axis of the two milkstains.
The Milkstains • The Greater Milkstain (GMS) has been known for centuries to break up into literally millions of stars when viewed with even a pair of binoculars. There appear to be about ten millions stars in total. • The Lesser Milkstain (LMS) does not break up into stars when observed with telescopes. It does, however, have some rather curious jet-like features emerging from it:
The Fuzzballs • In addition to stars, some curious fuzzy objects are seen scattered, with roughly uniform number density, all around the sky. They are similar to the jet-like features extending from the Southern Blue Spot (SBS). They vary enormously in brightness and size, though the larger ones tend to be brighter. Faint fuzzballs greatly outnumber the bright ones. Most fuzzballs are brighter and bigger than the LMS.
The Blue Spots • Both blue spots are roughly equally bright. They do not vary in brightness. Both are about as bright as a full moon. They are not just dots: they seem to consist of blue-white cores, surrounded by a paler fuzz that merges into the two Milkstains.
Recent Observations • We now present some recent observations made by Zoggian astronomers. • Note that Zoggian astronomers use SI units, just like earthlings.
Schnunka et al. • Schnunka et al. (from Mt Ztromlo Observatory) recently carried out, and published, a rather interesting study of fuzzballs. They obtained images of fuzzballs using the Bubble Space Telescope (BST). They asked for observations of the ten brightest and ten faintest fuzzballs. • The BST time allocation committee allocated half the time they asked for, allowing observations of ten fuzzballs in total (they were not convinced that the extra time would tell them anything interesting). The brightest five were taken from the Messier catalogue of bright fuzzballs.
They asked for observations of the ten faintest fuzzballs. Nobody has ever found the faintest fuzzballs: the harder you look, the more faint fuzzballs you see. Nobody has yet found a lower limit on how faint they can get. Also, really faint fuzzballs are very hard to observe: you need a huge telescope and a lot of exposure time. The time allocation committee therefore chose to give them observations of the five faintest fuzzballs in the New Fuzzball Catalogue, a catalogue of the thousand brightest fuzzballs in the sky. • All observations were made though a filter (the V filter) that allows light in the wavelength range 0.45-0.55 m to pass. Fluxes are quoted in W m-2 nm-1, ie. the rate at which energy hits a unit area of the telescope, per unit wavelength range the instrument is sensitive to.
Here is the picture of the brightest fuzzball: M23. Note that it is clearly made up of stars: around 10 million of them.
Here is the picture of the faintest fuzzball: NFC 761. Note the lack of detail: even with the Bubble Space Telescope, you cannot pick out details. • The faintest fuzzballs appear considerably smaller than the near ones. Their central surface brightness (Watts per square arcsecond), however, is roughly the same.
In all cases, the surface brightness of the fuzzballs declines with distance from the centre of the fuzzball r as: • The colours of the inner and outer parts of the fuzzballs are fairly similar, though the insides do appear to be marginally bluer in some cases.
Snag et al. (Max Zlank Institute) • These researchers recently published spectra of four fuzzballs in the jet extending from the Southern Blue Spot. • Their observations were taken with the Kemini Telescope.
They obtained spectra of four fuzzballs from one of the biggest jets, as shown below. The other fuzzballs were much fainter and would have taken more telescope time than was available to obtain adequate spectra. G1 G2 G3 G4
All four fuzzballs had similar spectra: spectra resembling those of typical stars. Relative Flux Observed Wavelength (nm)
The only significant differences between the spectra were that the lines were shifted. For example, hydrogen normally emits strongly (in the lab) at a wavelength of 486.1nm (due to electrons jumping from energy level 4 to energy level 2), and Oxygen at 372.7 nm. Here are the observed wavelengths of these lines:
Hoddly et al. (Green Mountain Observatory) • These researchers recently used the Bubble Space Telescope to measure the parallaxes of ten nearby stars. The ten brightest stars near declination zero were chosen. Measurable parallaxes were determined for all ten stars: it turns out that they are all at a distance of around 1017m. All ten have measured fluxes of around 10-11 W m-2 nm-1 in the V band. • One of these ten stars is a known variable: it pulses every three hours. The other nine are not known to be variable. The variable star has a maximum flux of 10-11 W m-2 nm-1 .
Costello et al. (Zarvard University) • This group didn’t make any new observations. Instead, they extracted information on the twenty brightest fuzzballs from the archives of the IRAS (Infra Red Astronomy Satellite) spacecraft. • The IRAS data was easy to obtain: during its 2 year mission IRAS photographed the whole sky: they just had to extract the relevant scans from ZASA’s (the Zog Air and Space Administration) computer archives. • IRAS mapped the whole sky at a wavelength of 60 microns.
The IRAS images were very disappointing. None of the fuzzballs emitted any detectable mid-IR flux. The only thing detected was the Southern Blue Spot, and even it was quite weak in the mid-IR. • Mid-IR radiation is emitted by objects with temperatures of around 100K. This usually means interstellar dust: stars are too hot to emit much mid-IR flux. So: whatever the fuzzballs are, they do not contain much interstellar dust. • Dust normally forms wherever stars are dying: the winds from old stars (planetary nebulae) contain heavy elements synthesised by nuclear fusion in their cores, and as the winds cool, these heavy elements condense out as tiny grains of graphite and silicates. • As these dust grains float around in space, starlight heats them up to around 100K, and they emit copious mid-IR radiation. But not in the fuzzballs. • Dust can be destroyed either by shockwaves, or by prolonged exposure to high temperature gas (one million degrees or more).
Lightnarg & Woolley (Zalifornia Institute of Technology) • This group have recently gone observing, with the aim of getting spectra of as many fuzzballs as possible.
The spectra were taken with the Mt Ztromlo 2.3m Advanced Technology Telescope. Unfortunately, this observatory is famous for cloudy weather: they only managed to get spectra of five fuzzballs and the Southern Milkstain through gaps in the clouds.
All five fuzzballs and the Southern Milk Stain have spectra that look like this. The SMS was far fainter than the fuzzballs. Relative Flux Observed Wavelength (nm)
They measured the wavelength of the H-beta line of Hydrogen: a spectral line with a laboratory wavelength of 486.13 nm. In all their spectra, this line had moved in wavelength one way or another by a small amount.
Hooligan & Thug, Zliverpool Tech • This group have spend the last year searching for supernovae with the 1m telescope at Siding Zpring Observatory. They slaved away at the telescope, taking thousands of pictures of various fuzzballs, looking for something that changed. • They found four supernovae. One was in the well known bright fuzzball M86. Three were found in fainter fuzzballs: in M12, NFC64 and, remarkably, in a fuzzball in one of the jets protruding from the Northern Blue Spot: B3.
Here are the before- and after images of the supernova in NFC64. The top image was taken while the supernova was at maximum brightness - the bottom one before it had exploded. • All the supernovae had very similar spectra, and they all showed the same pattern of brightening and fading.
Here is a table of the peak brightness reached by the various supernovae.
Chuck & Bride, Louiziana College of TAFE • These eminent researchers obtained spectra of the Greater Milkstain, and of both blue spots, using the William Herzhal Telescope in the Izlas Canarias.
The GMS is made up of many individual stars. To avoid being biassed by some particular star, the spectrograph slit was scanned across the GMS. Here is the integrated Spectrum. It has no red- or blue-shift. Relative Flux Observed Wavelength (nm)
The spectra of both blue spots were identical. There are no bumps or wiggles in the spectrum to measure a redshift from.