Download
1 / 6
60 likes | 141 Views
Supplemental Figure 1. A. B. Inhibitors concentration (µM).

E N D
Supplemental Figure 1 A B Inhibitors concentration (µM)
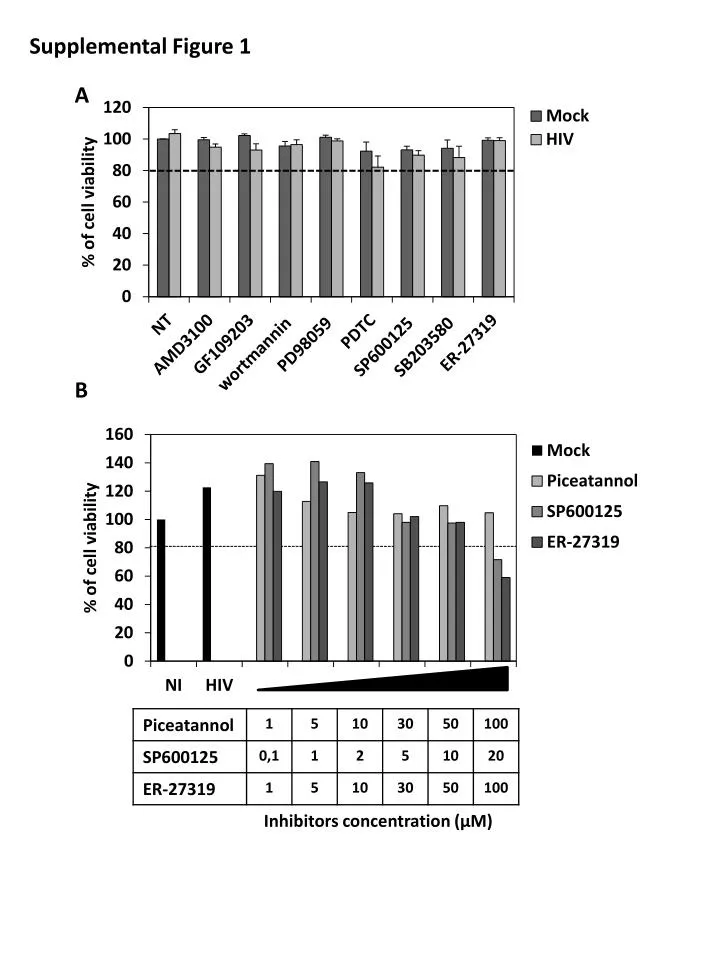
Supplemental Figure 1: B cell survival (A) B cells were pre-treated with kinase inhibitors (GF109203 (PKC, 0,5µM); wortmannin (PI3K, 100nM); PD98059 (MEK1, 5µM); PDTC (NF-κB, 5µM); SP600125 (JNK, 5µM); SB203580 (p38, 5µM) and ER-27319 (SYK, 50µM)) or with AMD3100 (100µM) for 4h before HIV-1 stimulation. 24h post-stimulation, percentages of cell viability were analyzed with 7AAD by flow cytometry. One representative experiment from 4 is represented (average+SEM). (B) B cells were pre-treated with increasing concentrations of JNK and SYK inhibitors (SP600125 (JNK, 0,1µM to 20µM); ER-27319 and Piceatannol (SYK 1µM to 100µM)) for 4h before HIV-1 stimulation. 24h post-stimulation, percentages of cell viability were analyzed with 7AAD by flow cytometry. Results from one representative experiment from two. Doted line represent the threshold of cell viability determined at 80% in comparison to Mock-NI condition.
Supplemental Figure 2 # # # # # # # * * * * # * * * Supplemental Figure 2: Cell activation and inhibition of activation by kinases inhibitors. B cells were pre-treated with kinase inhibitors (GF109203 (PKC, 0,5µM); wortmannin (PI3K, 100nM); PD98059 (MEK1, 5µM); PDTC (NF-κB, 5µM); SP600125 (JNK, 5µM); SB203580 (p38, 5µM); ER-27319 (SYK, 50µM); Piceatannol(SYK, 50µM)) and AMD3100 (100µM) for 4h before CD40L/IL-4 stimulation. 24h post-stimulation, iMFI of cells expressing CD71, CD69 or CD86 were followed by flow cytometry. Average of iMFI + SEM of minimum 4 experiments for each conditions (4 to 6 different donors for the NA (non-activated) conditions and 6 to 10 donors for the CD40L/IL-4 conditions). NA; Non-activated (*=p<0,05 when comparing NT-NA condition with kinase inhibitor-NA and #=p<0,05 when comparing NT-CD40L/IL-4 condition and kinases inhibitor-CD40L/IL-4). NT: non-treated.
Supplemental Figure 3 A * * * NT PDTC ER-27319 PD98059 SP600125 SB203580 GF109203 Piceatannol wortmannin B C # * # * #
Supplemental Figure 3: AID mRNA expression in CD40L/IL-4 treated B cells. (A) B cells were pre-treated with kinase inhibitors; GF109203 (PKC, 0,5µM); wortmannin (PI3K, 100nM); PD98059 (MEK1, 5µM); PDTC (NF-κB, 5µM); SP600125 (JNK, 5µM); SB203580 (p38, 5µM), ER-27319 (SYK, 50µM) or Piceatannol (SYK, 50µM) for 4h before CD40L/IL-4 stimulation or cells were kept non-activated as control. Two days after stimulation, total mRNA was extracted and AID mRNA were quantified by real-time PCR. Fold changes were calculated in comparison to non treated (NT) condition that was considered a fold change of 1. Each black (Non-activated conditions) or grey (CD40L/IL-4 stimulated conditions) plot represents one donor. Black bar represents the average of AID mRNA fold change . (B) B cells were stimulated with HIV, CD40L/IL-4 or with HIV/CD40L/IL-4 for 24h. iMFIof cells expressing CD71, CD69 or CD86 were followed by flow cytometry. Fold changes were calculated in comparison to NT-NA (Non-Activated) condition that is considered a fold change of 1. Average of iMFI + SEM of minimum 4 independent experiments for each conditions (4 or 5 different donors regarding the condition). #=p<0,05 when comparing HIV condition with HIV/CD40L/IL-4 and *=p<0,05 when comparing CD40L/IL-4 condition with HIV/CD40L/IL-4(C) B cells were stimulated with HIV, CD40L/IL-4 or with HIV/CD40L/IL-4. Two days after stimulation, total mRNA was extracted and AID mRNA were quantified by real-time PCR. Fold changes were calculated in comparison to NT-NA condition that is considered a fold change of 1. Average + standard deviation of 2 independent experiments is shown.
Supplemental Figure 4 V(D)J µ γ2 δ µ δ IgM GermlineIH-CH transcription CSR AID V(D)J γ2 IgG2 Excised DNA segment=circle transcript Productive (VDJ-CH) Ig transcript Supplemental Figure 4: Class Switch Recombination (CSR). Mechanism of class switch recombination that allows isotypeselection in mature activated B cells. This mechanism produces a DNA recombinant of the constant region of the immunoglobulin heavy chain and an excised DNA segment.