Download

1 / 36
360 likes | 445 Views
SOUTH CAROLINA EPIDEMIOLOGIC PROFILE 2011. What is the Epi Profile?. The HIV/AIDS Epidemiologic Profile is a document that: Describes the HIV/AIDS epidemic in various populations in South Carolina Identifies characteristics of:

E N D
SOUTH CAROLINA EPIDEMIOLOGIC PROFILE2011
What is the Epi Profile? The HIV/AIDS Epidemiologic Profile is a document that: • Describes the HIV/AIDS epidemic in various populations in South Carolina • Identifies characteristics of: • the general population (sociodemographic characteristics of the population) • HIV-infected populations (impact of HIV/AIDS on the population) • non-infected persons (who is at risk for becoming infected with HIV) • Serves as a source of quantitative data from which HIV prevention and care needs can be identified
Additional data available in an Integrated Epidemiologic Profile Characteristics of people with Sexually Transmitted Diseases (STDs) in South Carolina • Chlamydia • Gonorrhea • Infectious Syphilis Patterns of service utilization in South Carolina • Characteristics of Ryan White Part B clients • ADAP Patient Profile • Characteristics of persons who know they are HIV+ but who are not receiving HIV primary medical care
What are the sociodemographic characteristics of the population?
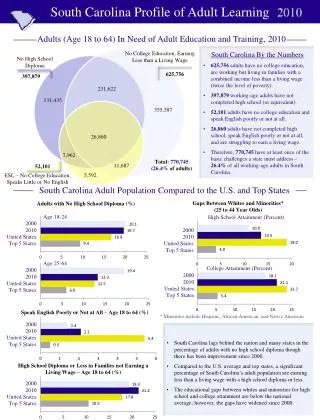
Selected demographic information: South Carolina and United States Sources: U.S. Census Bureau, Kaiser Family Foundation.
Percent of each racial/ethnic pop. living below federal poverty level; S.C., 2010 Poverty Gap Data Source: U.S. Census Bureau, American Community Survey.
What is the impact of HIV/AIDS on the population?
South Carolina HIV/AIDS incidence,prevalence, and deaths Number of Cases Note: number of cases diagnosed in S.C. only; excludes out of state cases returning to S.C.
Disproportionate S.C. HIV impact by gender Source: US Census Data; SCDHEC eHARS.
Proportion of persons living with HIV/AIDSby race/ethnicity, 2010
Deaths Due to AIDS (HIV) inSouth Carolina, 1990-2009 Source – Vital Records, S.C. Residence Data.
Characteristics of persons whose death was due to AIDS(HIV) in 2009 Source – Vital Records, S.C. Residence Data.
Proportion of persons living with HIV/AIDSby risk exposure, 2010N=11,159 Note: Total excludes cases with no risk identified.
Proportion of HIV/AIDS casesby risk exposure, 2009-2010N=1,040 Note: Total Excludes Cases with No Risk Identified.
Number of HIV/AIDS casesby year of diagnosis and risk, 2000-2010 Number of Cases Excludes persons with no risk reported.
Proportional distribution of male HIV/AIDS casesby exposure category, diagnosed 1999-2010 Percent of Total Cases with Reported Risk
Proportional distribution of female HIV/AIDS cases, by exposure category, diagnosed 1999-2010 Percent of Total Cases with Reported Risk
Proportion of men with HIV/AIDS who have sex with men by race/ethnicity, diagnosed 2009-2010N=753
Proportion of heterosexual HIV/AIDS cases by race/ethnicity, diagnosed 2009-2010N=228
Proportion of injecting drug users diagnosed with HIV/AIDS 2009-2010 by race/sex N=38
Proportion of high school studentsindicating sexual risks, 2005-2011 Percent Source – SC Dept. of Education & CDC
Characteristics of people with Sexually Transmitted Diseases (STDs) in South Carolina
South Carolina reported Chlamydia casesby year of diagnosis, 2000-2010 Number of Cases Year
South Carolina reported gonorrhea casesby year of diagnosis, 2000-2010 Number of Cases Year
South Carolina reported Infectious Syphilis casesby year of diagnosis, 2000-2010 Number of Cases
What are the patterns of service utilization of persons living with HIV/AIDS?
Characteristics of Ryan White Part B clients comparedto S.C. persons living with HIV/AIDS in 2010
2010 ADAP Patient Profile Compared to Persons Living with HIV/AIDS
What are the characteristics of persons who know they are HIV+ but who are not receiving HIV primary medical care?
“In Care” and “Not in Care” defined: • A person was reported as being “in care” if they had at least one CD4 or viral load test report in 2010, and that was > 30 days after diagnosis • A person with no CD4 or viral load test report in this time frame would be defined as “not in care”
2010 S.C. HIV/AIDS cases estimated not in care vs. in care (N=16,378)
S.C. HIV/AIDSCases NOT in care diagnosedthrough 2010 by mode of exposure Excludes cases with no risk identified, N = 4,682.
Kirk A. Shull S.C. DHEC 803-898-0284 shullka@dhec.sc.gov http://www.scdhec.gov/health/disease/stdhiv/docs/Epidemiologic Profile of HIV and AIDS in SC 2011.pdf