
Statistical Experiment
E N D
Presentation Transcript
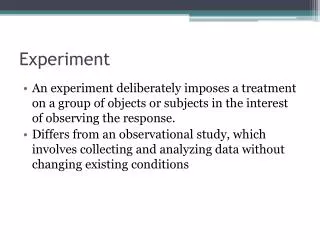
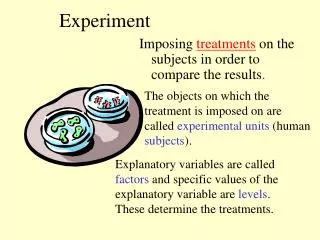
Statistical Experiment A statistical experiment or observation is any process by which an measurements are obtained
Examples of Statistical Experiments • Counting the number of books in the College Library • Counting the number of mistakes on a page of text • Measuring the amount of rainfall in your state during the month of June
Random Variable a quantitative variable that assumes a value determined by chance
Discrete Random Variable A discrete random variable is a quantitative random variable that can take on only a finite number of values or a countable number of values. Example: the number of books in the College Library
Continuous Random Variable A continuous random variable is a quantitative random variable that can take on any of the countless number of values in a line interval. Example: the amount of rainfall in your state during the month of June
Probability Distribution an assignment of probabilities to the specific values of the random variable or to a range of values of the random variable
Probability Distribution of a Discrete Random Variable • A probability is assigned to each value of the random variable. • The sum of these probabilities must be 1.
Probability distribution for the rolling of an ordinary die x P(x) 1 2 3 4 5 6
Features of a Probability Distribution x P(x) 1 2 3 4 5 6 Probabilities must be between zero and one (inclusive) P(x) =1
Probability Histogram P(x) | | | | | | | 1 2 3 4 5 6
Mean and standard deviation of a discrete probability distribution Mean = = expectation or expected value, the long-run average Formula: = x P(x)
Finding the mean: x P(x) x P(x) 0 .3 1 .3 2 .2 3 .1 4 .1 0 .3 .4 .3 .4 = x P(x) = 1.4 1.4
Finding the standard deviation x P(x) x – ( x – ) 2 ( x – ) 2 P(x) 0 .3 1 .3 2 .2 3 .1 4 .1 .588 .048 .072 .256 .676 – 1.4 – 0.4 .6 1.6 2.6 1.96 0.16 0.36 2.56 6.76 1.64
Standard Deviation 1.28
Linear Functions of a Random Variable If a and b are any constants and x is a random variable, then the new random variable L = a + bx is called a linear function of a random variable.
If x is a random variable with mean and standard deviation , and L = a + bx then: • Mean of L = L = a + b • Variance of L = L2 = b22 • Standard deviation of L = L= the square root of b22 = b
Find the mean of L. Find the variance of L. Find the standard deviation of L. L = 2 + 5 Variance of L = b22 = 25(9) = 225 Standard deviation of L = square root of 225= If x is a random variable with mean = 12 and standard deviation = 3 and L = 2 + 5x
Independent Random Variables Two random variables x1 and x2 are independent if any event involving x1 by itself is independent of any event involving x2 by itself.
If x1 and x2 are a random variables with means and and variances and If W = ax1 + bx2 then: • Mean of W = W = a + b • Variance of W = W2 = a212 + b22 • Standard deviation of W = W= the square root of a212 + b22
Find the mean of W. Find the variance of W. Find the standard deviation of W. Mean of W = 2(12)+ 5(8) = 64 Variance of W = 4(9) + 25(4) = 136 Standard deviation of W= square root of 136 11.66 Given x1, a random variable with1 = 12 and 1 = 3 and x2 is a random variable with 2 = 8 and 2 = 2 and W = 2x1 + 5x2.