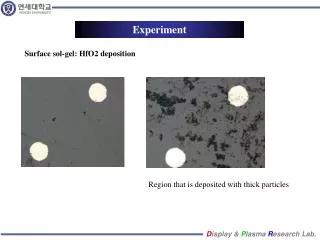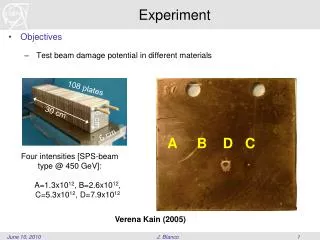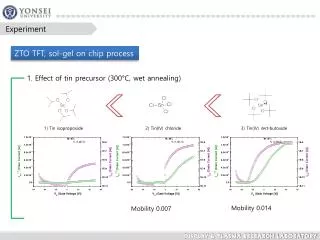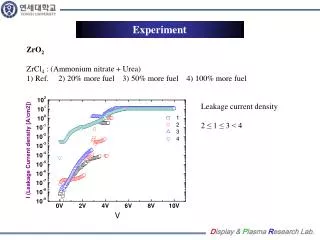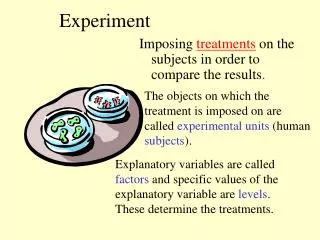
Experiment
Moisture Measurement in Meat Products by Temperature Controlled Microwave Drying to a Constant Weight S. P. Hailey 1* , C.R. Moser 1 , B.J. Haire 1 , J.T. Keeton 2 1 CEM Corporation, Matthews, USA; 2 Texas A&M University, USA Steve.Hailey@cem.com. Experiment.

Experiment
E N D
Presentation Transcript
Moisture Measurement in Meat Products by Temperature Controlled Microwave Drying to a Constant WeightS. P. Hailey1*, C.R. Moser1, B.J. Haire1, J.T. Keeton21CEM Corporation, Matthews, USA; 2Texas A&M University, USASteve.Hailey@cem.com
Experiment Comparison of Moisture Determination by Temperature Controlled Microwave Drying to a Constant Weight with AOAC Convection Oven Reference Method in Meat and Poultry Samples for NMR Fat Analysis
Participating Laboratories • CEM Corporation (submitting laboratory) • Texas A&M Univ. Meat Science (peer laboratory) • Special thanks to: Dr. Jimmy Keeton & his staff
Apparatus • Moisture Determination • Forced Air Oven • Microwave Moisture/Solids Analyzer • Fat Determination • Petroleum Ether Extraction Equipment • Nuclear Magnetic Resonance
MicrowaveMoisture Testing • Tare 2 glass fiber sample pads • Apply sample to pads and press “start” • Microwave System: • Takes initial sample weight • Starts microwaves • IR Temperature feedback controls microwave power • Measures weight loss • 0.1mg balance • Takes final sample weight • Displays %Moisture or %Total Solids
Infrared Data Microwave Drying Using IR Temperature Control Magnetron Power Control Microwave Energy Microprocessor Infrared Sensor Actual Set
Smart System 5TM IR Temperature Sensor Cavity Exhaust Air Shield Magnetron CPU Balance
Temperature Controlled Drying to Constant Weight 3.5 3 2.5 2 1.5 1 0.5 0 200 180 160 140 120 100 80 60 40 20 0 Standardize Methods by Controlling Temperature and Monitoring Weight Loss During Drying IR Temperature oC Sample Weight (gms) 0 :30 1:00 1:30 2:00 2:30 Time
Fat Determination on Dried Sample by NuclearMagneticResonance
Why to Dry the Sample • In the NMR we are going to cause a energy change in our sample. Force all protons to High Energy State. • Water, Fat, Protein, Carbohydrates • Measure the Free Induction Decay (FID) as the sample reverts or “Relaxes” Back to Equilibrium (low energy state). • Water and Fat have very similar signal
How to Solve Interference of Water with Fat • Using spin echo or other techniques in the NMR • OK for low moisture products • More difficult for high moisture products • Requires up to 20 minuets conditioning in heater block • Dry Sample to Remove Water • Convection oven drying is too slow for process control • IR moisture balance • Slow for high moisture samples • Sample degradation • Microwave Drying • Fastest technique • No sample degradation
Moisture AOAC method 950.46(b) for moisture analysis 100 – 102 oC for 16 hours Fat AOAC method 960.39(a) for fat analysis Petroleum ether extraction for 16 hours Reference Data
Sample Preparation • Approximately 11 kg of freshly processed products from each category were collected. • Diced samples into 5 cm cubes and passed 2 times through Hobart grinder with 4.8mm plate. • Ground meat products were homogenized in Robot Coupe bowl chopper to a paste.
Comparison Data • Data collected on CEM SMART Trac System at Texas A&M • Data collected on CEM SMART Trac System at CEM Corporation • Reference data collected at Texas A&M
Beef AOAC CEM TAM AOAC CEM TAM Sample ID %M %M %M %F %F %F Beef #1 Average 75.09 75.41 74.92 4.01 3.99 4.16 Range 0.62 0.29 0.20 0.23 0.16 0.18 Std. Dev. 0.32 0.09 0.06 0.13 0.05 0.07 Beef #2 Average 67.29 67.93 67.44 11.92 11.97 12.15 Range 0.30 0.26 0.26 1.01 0.16 0.20 Std. Dev. 0.17 0.09 0.09 0.48 0.05 0.05 Beef #3 Average 45.38 45.32 45.60 39.59 39.57 40.27 Range 1.59 0.54 0.51 1.59 0.84 0.53 Std. Dev. 1.12 0.14 0.15 0.67 0.28 0.16 Beef #4 Average 27.76 28.14 27.66 63.28 63.34 64.02 Range 2.46 1.02 0.64 1.32 1.43 0.48 Std. Dev. 1.12 0.30 0.20 0.70 0.41 0.16
Pork AOAC CEM TAM AOAC CEM TAM Sample ID %M %M %M %F %F %F Pork #1 Average 73.85 74.68 74.53 3.33 3.35 3.52 Range 0.42 0.20 0.74 0.16 0.14 0.20 Std. Dev. 0.17 0.06 0.21 0.09 0.04 0.06 Pork #2 Average 65.71 66.27 66.13 14.11 14.36 14.48 Range 0.34 0.47 0.64 0.52 0.54 0.40 Std. Dev. 0.15 0.14 0.18 0.22 0.16 0.12 Pork #3 Average 50.01 50.30 50.11 33.79 33.94 34.17 Range 0.86 0.30 0.70 0.10 0.52 0.41 Std. Dev. 0.36 0.08 0.25 0.06 0.15 0.15
Turkey AOAC CEM TAM AOAC CEM TAM Sample ID %M %M %M %F %F %F Turkey #1 Average 74.83 74.55 75.45 2.88 2.93 2.93 Range 1.05 0.24 0.81 0.07 0.13 0.16 Std. Dev. 0.51 0.09 0.25 0.05 0.04 0.05 Turkey #2 Average 74.57 74.41 73.84 5.89 5.66 5.85 Range 1.19 0.29 0.24 0.66 0.07 0.06 Std. Dev. 0.56 0.05 0.09 0.11 0.02 0.03 Turkey #3 Average 48.97 47.04 45.73 32.20 32.05 31.05 Range 0.37 1.01 2.18 0.23 0.79 1.65 Std. Dev. 0.19 0.36 0.62 0.12 0.23 0.50
Chicken AOAC CEM TAM AOAC CEM TAM Sample ID %M %M %M %F %F %F Chicken #1 Average 74.84 75.22 74.87 2.59 2.47 2.59 Range 1.43 0.30 0.88 0.63 0.21 0.25 Std. Dev. 0.20 0.16 0.25 0.27 0.07 0.08 Chicken #2 Average 71.48 71.44 70.77 10.06 9.85 10.73 Range 0.01 0.29 0.23 0.07 0.40 0.32 Std. Dev. 0.05 0.08 0.08 0.04 0.11 0.09 Chicken #3 Average 52.11 52.84 52.76 36.01 35.97 35.77 Range 1.19 1.11 0.57 0.84 0.31 0.22 Std. Dev. 0.09 0.08 0.25 0.33 0.02 0.15
Pork Sausage AOAC CEM TAM AOAC CEM TAM Sample ID %M %M %M %F %F %F Pork Sausage #1 Average 77.35 77.30 77.16 1.30 1.27 1.29 Range 0.29 0.23 0.53 0.57 0.14 0.16 Std. Dev. 0.15 0.09 0.16 0.30 0.05 0.05 Pork Sausage #2 Average 62.21 62.40 62.54 19.17 18.54 18.41 Range 0.57 0.34 0.59 0.64 0.46 0.36 Std. Dev. 0.24 0.09 0.19 0.34 0.15 0.12 Pork Sausage #3 Average 52.98 52.94 53.20 31.58 31.55 31.28 Range 0.35 0.27 0.49 0.74 0.61 0.68 Std. Dev. 0.18 0.08 0.17 0.30 0.19 0.23 Pork Sausage #4 Average 46.82 46.62 46.50 39.22 39.24 39.15 Range 0.65 0.43 0.36 0.54 0.65 0.45 Std. Dev. 0.28 0.13 0.12 0.25 0.21 0.14
Cooked Sausage AOAC CEM TAM AOAC CEM TAM Sample ID %M %M %M %F %F %F Hot Dogs #1 Average 75.68 75.16 75.16 0.53 0.52 0.72 Range 0.55 0.45 0.49 0.01 0.20 0.34 Std. Dev. 0.33 0.16 0.19 0.01 0.06 0.11 Hot Dogs #2 Average 64.46 64.66 63.83 15.83 15.40 16.09 Range 0.45 0.38 0.44 0.97 0.39 0.41 Std. Dev. 0.21 0.12 0.15 0.51 0.12 0.13 Hot Dogs #3 Average 52.56 52.43 52.11 30.75 30.73 30.93 Range 1.04 0.19 0.40 0.66 0.57 0.35 Std. Dev. 0.43 0.05 0.14 0.32 0.17 0.14
Ham AOAC CEM TAM AOAC CEM TAM Sample ID %M %M %M %F %F %F Ham #1 Average 75.96 76.45 76.71 2.11 2.04 2.10 Range 0.55 0.19 0.71 0.32 0.13 0.22 Std. Dev. 0.27 0.07 0.21 0.23 0.05 0.07 Ham #2 Average 73.50 73.50 73.38 2.52 2.57 2.63 Range 0.30 0.24 0.78 0.30 0.09 0.26 Std. Dev. 0.13 0.08 0.26 0.15 0.02 0.08 Ham #3 Average 55.51 54.96 54.08 20.59 20.57 21.43 Range 0.78 0.69 0.35 0.72 0.59 0.17 Std. Dev. 0.32 0.24 0.10 0.33 0.20 0.06 Ham #4 Average 65.68 65.46 65.33 10.51 10.53 10.65 Range 0.39 0.18 0.55 0.06 0.20 0.32 Std. Dev. 0.16 0.05 0.15 0.04 0.08 0.09
Beef, fresh ground , high fat AOAC CEM TAM AOAC CEM TAM Sample ID %M %M %M %F %F %F 46.34 46.15 46.08 46.25 46.19 45.99 45.59 45.65 45.50 45.87 45.96 0.295 45.68 46.25 46.27 45.93 46.24 46.40 45.94 45.92 45.85 45.54 46.00 0.280 46.03 45.86 45.83 45.54 45.92 45.73 45.64 45.92 45.93 45.99 45.84 0.157 40.69 40.23 40.18 40.68 40.24 40.32 40.42 40.39 40.42 40.59 40.42 0.184 40.19 40.13 40.26 40.20 40.19 40.35 40.44 40.33 40.36 40.32 40.28 0.098 40.44 40.42 40.35 40.26 40.49 40.34 40.41 40.44 40.30 40.45 40.39 0.074 1 2 3 4 5 6 7 8 9 10 Mean SD
Chicken, fresh with skin AOAC CEM TAM AOAC CEM TAM Sample ID %M %M %M %F %F %F 7.25 7.34 7.33 7.32 7.29 7.26 7.24 7.25 7.30 7.27 7.29 0.036 7.29 7.14 7.22 7.21 7.08 7.16 7.07 7.10 7.07 7.11 7.15 0.074 74.28 74.23 74.38 74.18 74.32 74.42 74.55 74.40 74.41 74.54 74.37 0.121 74.55 74.51 74.66 74.65 74.53 74.42 74.65 74.25 74.25 74.31 74.48 0.162 7.36 7.50 7.02 7.49 7.08 7.06 7.16 7.08 7.41 7.20 7.24 0.186 74.52 74.56 74.59 74.55 74.52 74.60 74.60 74.58 74.64 74.56 74.57 0.038 1 2 3 4 5 6 7 8 9 10 Mean SD
NIST SRM 1546 AOAC CEM TAM AOAC CEM TAM Sample ID %M %M %M %F %F %F 20.97 21.13 20.91 20.52 20.94 20.98 20.62 21.08 20.73 21.11 20.90 0.207 21.77 21.76 21.62 21.60 21.79 21.58 21.71 21.61 21.56 21.48 21.65 0.104 59.24 58.90 58.76 58.73 58.92 58.73 59.02 58.77 58.70 58.53 58.86 0.205 58.64 58.44 58.45 58.53 58.31 58.59 58.41 58.47 58.54 58.44 58.48 0.095 21.69 21.69 21.71 21.37 21.58 21.32 21.14 21.93 21.99 21.94 21.64 0.286 59.37 59.54 59.41 59.38 59.53 59.24 59.41 59.49 59.15 58.98 59.35 0.178 1 2 3 4 5 6 7 8 9 10 Mean SD Note: Three different cans of NIST material were used for the above results. NIST Reference Values: Moisture 59.5% +/-2.6%; fat value 21.0% +/-1.4%
All Beef Hot Dogs AOAC CEM TAM AOAC CEM TAM Sample ID %M %M %M %F %F %F 30.30 30.77 30.60 30.29 30.36 30.63 30.45 30.40 30.63 30.71 30.51 0.175 30.63 30.64 30.28 30.46 30.65 30.36 30.72 30.57 30.42 30.71 30.54 0.154 51.79 51.96 51.58 51.59 51.97 51.47 51.66 51.97 51.69 51.49 51.72 0.195 51.55 51.42 51.64 51.53 51.46 51.47 51.38 51.26 51.44 51.17 51.43 0.138 30.59 30.61 30.44 30.53 30.63 30.36 30.72 30.20 30.54 30.18 30.48 0.183 51.51 51.45 51.64 51.54 51.63 51.75 51.87 51.89 51.80 51.69 51.68 0.152 1 2 3 4 5 6 7 8 9 10 Mean SD
Pork, fresh, low fat AOAC CEM TAM AOAC CEM TAM Sample ID %M %M %M %F %F %F 3.77 3.85 3.94 3.87 3.92 3.93 3.80 4.05 3.79 3.85 3.88 0.085 3.75 3.74 3.77 3.78 3.78 3.77 3.79 3.74 3.74 3.77 3.76 0.019 73.65 73.76 73.72 73.88 73.73 73.69 73.81 73.46 74.00 73.75 73.75 0.142 73.90 73.79 73.74 73.60 73.77 73.74 73.66 73.70 73.73 73.58 73.72 0.094 3.75 3.86 3.44 3.69 3.84 3.95 3.76 3.78 3.58 3.78 3.74 0.146 73.90 73.91 73.83 73.93 74.06 74.03 74.00 74.02 73.92 73.80 73.94 0.087 1 2 3 4 5 6 7 8 9 10 Mean SD
Summary • AOAC Methods for Moisture in Meat by Microwave Drying • Official Method 985.14 final action 1991 • Peer Verified Method PVM1:2003, issued 2003 • Temperature Controlled Microwave Drying • Allows method transfer to different instruments without adjustment of drying program • Avoids heat degradation of sample • Dried sample available for NMR fat determination • Sample is automatically temperature conditioned for NMR • Avoids temperature conditioning in heater block • Constant Weight Drying • Classical method for weight loss on drying determination • Assures moisture is removed from sample • Optimized drying time