CULTURAL CAPITAL AND VISUAL ARTS Elizabeth Silva e.b.silva@open.ac.uk Cultural Capital and Social Exclusion: A critical investigation ESRC funded Mar 2003 Mar 2006 Tony Bennett, Mike Savage, Elizabeth Silva and Alan Warde Web site address for CCSE
By jadenForeclosure: The Crisis That Hits Home . 2009 Washington State Access to Justice Conference Justice: Hope and Help in Hard Times j ohn a. powell
By LeoExploring the Determinants of Entrepreneurial Culture Scott Loveridge Steven R. Miller Thasanee Satimon. Session 55 Saturday, October 24, 2009 Kansas City, MO. Missouri Valley Economic Association Forty-Sixth Annual Meeting. 1. Towards a Measure of Entrepreneurial Culture.
By elinaSocial-Ethnic Challenges. Old and new. Immigration (“Aliyah”= Ascent) Synopsis. 1948-1992 2.3 Million Jewish Immigrants Yearly average: 50,000 Jewish population (year 2000): 5 Million Arab population 1.3 Million Total population today: 7,000,000
By caleVan Wert High School High Schools That Work. Our last year in the old VWHS. Van Wert High School LeadershipTeam. Arlene Hurless – Site Coordinator - Retired VWHS Teacher Bill Clifton – Principal VWHS Mary Kramer – Science – HS Coordinator Charlie Witten – Math – HS Coordinator
By tolaEthnicity, Race and Immigration in the US. Changing ethnic composition of new immigrant populations . The Classic era: 1901-1930 Shifting from Northern Europeans to Southern and Eastern Europeans 1924 National Origins Act Total immigration 18,638,000 79.6% from Europe, 16.2% from Americas
By khuongВЧЕРАШНИЕ КОЧЕВНИКИ И СОВРЕМЕННЫЕ ДЕНЬГИ. YESTURDEY’S NOMADS & MODERN MONEY. MAP OF RUSSIA (red – Altai Republic). MAP ALTAI REPUBLIC. TABLE OF DISTANCES. N OVOSIBIRSK - BARNAUL 240 KM - 370 KM BIYSK BIYSK - MAYMA 90 KM
By callumCULTURE BUILDS…. VIBRANCY!. IN THE BEGINNING…. HELPING RETAIL HAPPEN. Private Sector. Public Sector. Community. HELPING RETAIL HAPPEN. We are a great neighborhood, really want to shop local; we’re totally awesome and you should have a store here.
By ashTexas Demographic Characteristics and Trends. Texas Association of Mutual Insurance Companies October 7, 2010 Round Rock, TX. 25 Million Reasons to be Proud of Texas (among a few more). Demographic Highlights TEXAS is:
By ksenaPopulation Trends: Tulsa County, Tulsa and North Tulsa 2000 to 2010. Prepared by The Community Service Council with Support from The Metropolitan Human Services Commission (MHSC) Draft: July 13, 2011 Data Source: US Census Bureau, Decennial Censuses. Tulsa County and City of Tulsa.
By abiolaTexas and Waco: Demographic Characteristics and Trends. Waco Business League April 10, 2012 Waco, TX. Growing States, 2000-2010. 15.7% of numerical change in U.S. . Note: Population values are decennial census counts for April 1, 2000 and April 1, 2010.
By xanthePockets of Excellence: Benchmarking Primary Education Mathematics Learner Performance in South Africa . Is SA’s education system one of the worst in Africa / World? . South Africa’s education system has been strongly criticised over the past few years: textbook shortages
By thadThe Majority Status of Arkansas Minority Populations: Transitioning to a Hispanic Major Minority Gregory L. Hamilton, Ph.D. Institute for Economic Advancement University of Arkansas at Little Rock
By lazarTexas Demographic Characteristics and Trends. Texas Department of Insurance–Consumer Protection March 31, 2011 Austin, TX. 25 Million Reasons to be Proud of Texas (among a few more). Demographic Highlights TEXAS is:
By minorPromoting Inter-municipal Cooperation -Challenges and Opportunities the case of Macedonia. Presenter: Vesna Dzuteska Bisheva 8 December 2005. Macedonia and the EU Economic development indicators on the level of NUTS II. Nominal convergence. Inflation rate 2% Budget deficit 0.9%
By kenyonPurpose. “The goal of this chartbook is to create an easily accessible resource that can help policy makers, teachers, researchers, and practitioners begin to understand disparities in their communities and to formulate solutions.”. Highlights. The Demographics of America
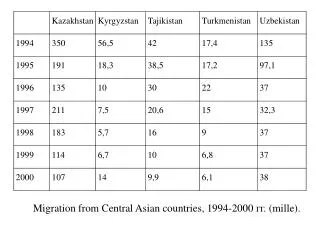
By dympnaMigration from Central Asian countries, 1994-2000 гг . (mille). Statistical data about citizens of foreign countries on the territory of Russian Federation (November 13th, 2013 ). Ethnic composition of Russia according to the censuses of 1989, 2002, 2010.
By kaipoGEOGRAPHY and WEIGHTS IN THE NLS. By Randall Olsen. The Plan for this Module. Basics of geographic data Geography and sampling Level of detail available in the NLS and GIS data How you get geographic data Weighting Correct standard errors and geo-variables
By merrillReadiness and Illinois’ 21 st Century Workforce. Jennifer B. Presley Illinois Education Research Council ierc.siue.edu. A Few Reminders about Illinois’ Job Market. Between 1990 and 2005, Illinois lost 24% of its manufacturing industry jobs (-225,000, usually higher paying jobs).
By fosterView Ethnic composition PowerPoint (PPT) presentations online in SlideServe. SlideServe has a very huge collection of Ethnic composition PowerPoint presentations. You can view or download Ethnic composition presentations for your school assignment or business presentation. Browse for the presentations on every topic that you want.