Download
1 / 14
160 likes | 454 Views
Live oil – surfactant phase behavior. Aparna Sagi , Maura Puerto , Clarence Miller, George Hirasaki April 23, 2012. Introduction. Surfactants ultra low IFT EOR Optimal salinity (ultra-low IFT) for a surfactant system dependent on Oil composition: dead vs live oil

E N D
Live oil – surfactant phase behavior AparnaSagi, Maura Puerto, Clarence Miller, George Hirasaki April 23, 2012
Introduction • Surfactants ultra low IFT EOR • Optimal salinity (ultra-low IFT) for a surfactant system dependent on • Oil composition: dead vs live oil • Temperature, pressure, WOR, etc • Objective: Determine and compare surfactant optimal salinity for dead and live crude oil (CO2, CH4,C2H6)
System description • Temperature: 30ºC • Surfactant: S13D/S2 (90/10 wt.) 1wt% (aq.) • S13D: iC13 -13PO sulfate • S2: C15-18 internal olefin sulfonate • Brine: 11,000ppm (incl. Ca2+, Mg2+) – TB2 • Crude oil: 28º API (dead) with • No dissolved gas (dead oil) • Methane @ 600psi • Ethane @ 50psi, 95psi • Carbon dioxide @ 60psi, 600psi
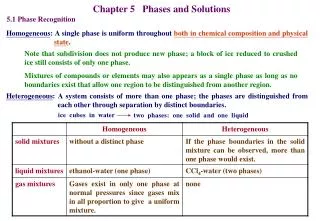
Experimental procedure – dead oil 24 hr Seal open end Oil Initial interface Brine + surfactant Pipette (bottom sealed) Varying salinity micro micro Winsor Type - I Winsor Type - II Winsor Type - III Optimal salinity
Experimental procedure – live oil Purge cell of air Make live oil Inject surf. solution Gas Gas P P P P P Oil Surf.soln. Observe phases Hand mix sample Inc. temp. to 30°C
Results – dead oil Salinity (% TB2) 70% 80% 90% 100% 110% 120% OIL Vo/Vs ~ 6 Optimal Initial w/o interface MACRO EMULSION MICRO EMULSION WATER Type II Type II Type I Type I Type I Type II
Results – Methane @ 600psi Salinity (% TB2) 50% 70% 90% 110% OIL Optimal Initial w/o interface MACRO EMULSION MICRO EMULSION WATER Type I Type I Type II Type II
Results – Ethane @ 50psi Salinity (% TB2) 50% 60% 70% 80% Vo/Vs ~ 13 Optimal OIL/ OIL+MACRO Initial w/o interface MACRO MICRO EMULSION WATER Type I Type I Type I Type II
Results – Ethane @ 95psi Salinity (% TB2) 30% 40% 50% 60% OIL Optimal Initial w/o interface MACRO MICRO EMULSION WATER Type I Type I ?? Type II
Results – CO2 @ 60psi Salinity (% TB2) 70% 80% 90% 100% OIL Optimal Initial w/o interface MACRO MICRO EMULSION WATER Type I Type I Type I Type II
Results –CO2 @ 600psi Salinity (% TB2) 10% 20% 30% 40% 50% OIL Optimal Initial w/o interface MICRO EMULSION MACRO WATER Type I Type I Type I Type II Type II
Consolidated results Methane CO2 Ethane
Conclusions • The effect of dissolved gas (upto 600psi) on surfactant optimal salinity (CØ) has been demonstrated • Methane • Slight decrease in optimal salinity • Carbon dioxide • Decrease in the optimal salinity • Ethane • Substantial decrease in optimal salinity