Download
1 / 17
170 likes | 375 Views
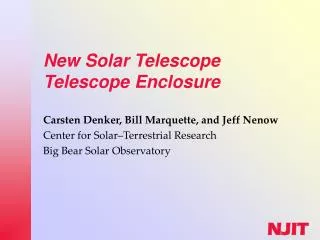
Thirty. T. Meter. M. Telescope. T. Wind Tunnel Testing of a Generic Telescope Enclosure. Tait S. Pottebaum Douglas G. MacMynowski* California Institute of Technology June 2004. *formerly D. MacMartin macmardg@cds.caltech.edu. Experiment . Model: Empty telescope enclosure

E N D
Thirty T Meter M Telescope T Wind Tunnel Testing of a Generic Telescope Enclosure Tait S. Pottebaum Douglas G. MacMynowski* California Institute of Technology June 2004 *formerly D. MacMartin macmardg@cds.caltech.edu
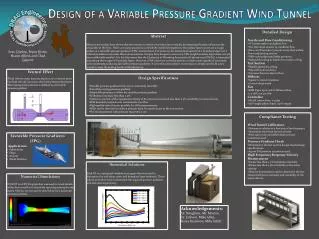
Experiment • Model: • Empty telescope enclosure • Square opening • size appropriate for roughly f/1.3 • 30° Zenith angle (fixed) • Diameter = 0.83m, ~1% scale • Turbulent flow at M2 location • Probably not turbulent at M1 location • Data: • Flow visualization • Digital particle image velocimetry (DPIV) data in a vertical plane containing the telescope axis near the dome opening • Hot-wire anemometer data along the axis of the telescope
Scaling Dimensionless parameters where L is the side length of the opening Convective frequency scaling Helmholtz frequency scaling where V is the enclosed volume and c is the speed of sound
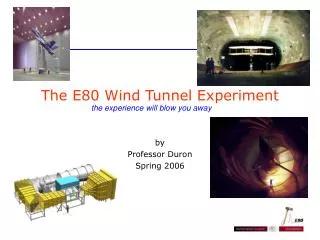
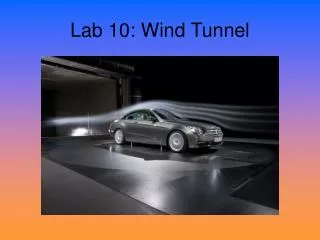
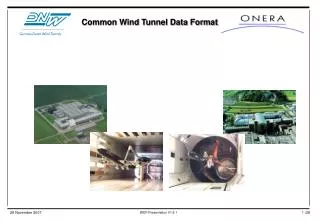
Experimental Setup • Clear Lucite dome with opening • Camera and mirror for visualization & DPIV • Hotwire mounted on traverse • Mirror and optics for laser sheet • Lucas adaptive wall wind tunnel • 5’ by 6’ un-adapted • Mounted on turn-table
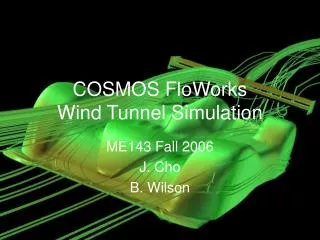
Smoke Visualization U∞ • 0° azimuth • Smoke injected from outside the dome
Velocity (hot-wire) spectrum inside enclosure data at 0°, r/R = 0.934 Dominant 1st peak Large 2nd peak -5/3 slope 35m/s 20m/s fH fH • Shear layer modes: • Frequency: f ~ 0.65nU/L • Present for AZ ≤ 90° • Mode n depends on speed; influenced by Helmholtz mode
DPIV data • Focus on area near the opening • Principle of measurements • Seed flow with tracer particles (water droplets) • Illuminate a thin sheet with a laser (vertical plane on centerline of dome) • Synchronize laser with the camera • Record images in pairs with small time separation • Correlate small regions of image to determine displacement • Weaknesses • In regions of steep gradients, velocity is typically underestimated • Scales smaller than the interrogation regions cannot be resolved • Only the in-plane components of velocity are measured • Obtain mean and statistics from large number of image pairs • 2400 pairs for 0° • 4495 pairs for 180°
Conclusions • Upwind viewing • Shear layer across enclosure opening periodically rolls up into large vortices • Frequencies are well described by convection velocity of shear layers and a mode number • Mode selection may be influenced by coupling of the shear layer instability with Helmholtz oscillations • Large fluctuation velocities are likely to exert significant unsteady forces on the secondary mirror and support structure • Downwind viewing • Opening is inside the wake recirculation • Mean velocity local maximum exists inside the dome • Fluctuation levels are low, so most forces are likely to be steady
Further analysis • Data being used for comparison with CFD (Konstantinos Vogiatzis, AURA NIO) • Additional testing done with venting; data analysis in progress. • Significant attenuation of shear layer modes