Download
1 / 5
50 likes | 129 Views
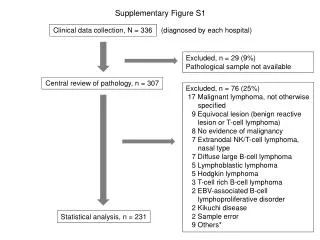
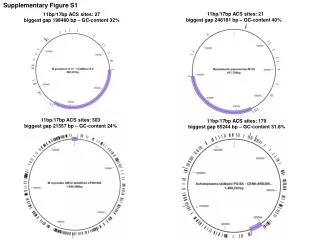
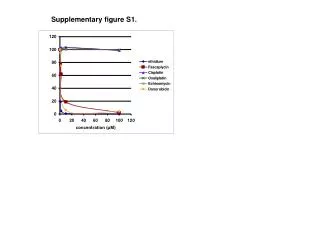
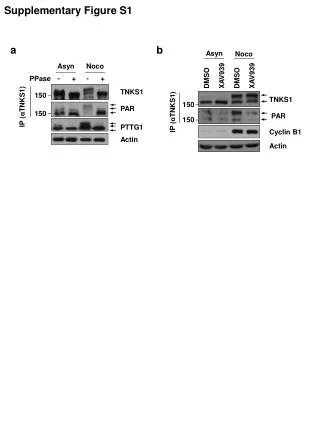
This study by Coelho et al. (2014) examines how LNA influences gene expression. It includes data on exon sequences, protein denaturation, and aggregation.

E N D
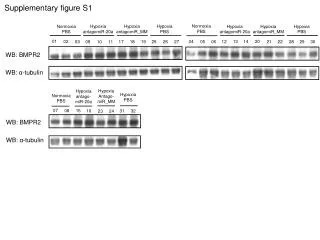
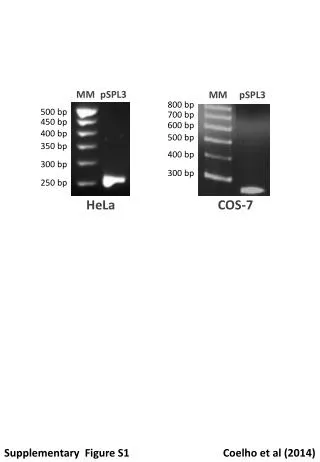
MM pSPL3 MM pSPL3 800 bp 500 bp 700 bp 450 bp 600 bp 400 bp 500 bp 350 bp 400 bp 300 bp 300 bp 250 bp HeLa COS-7 Supplementary Figure S1 Coelho et al (2014)
exon 9 exon 9 gtcagtctcccaggtaggatcctggggc exon 8 3’- gtccatcctaggacc - 5’ LNA1 10 nt gtcagtctcccaggtaggatcctggggc exon 8 3’- agagggtccatcctag - 5’ LNA2 5 nt Supplementary Figure S2 Coelho et al (2014)
-LNA +LNA1(0.5 μM) MM 400 bp 300 bp Supplementary Figure S3 Coelho et al (2014)
A p.D274Gfs*17 WT ~45 kDa ~35 kDa B C Supplementary Figure S4 Coelho et al (2014)
A Denatured protein (normalized) [θ] (mdeg.cm-2.dmol-1) a b a b B T (°C) λ (nm) T (°C) C b b a Aggregated protein (normalized) Aggregated protein (normalized) a D T (°C) Time (min) Supplementary Figure S5 Coelho et al (2014)