Download
1 / 3
30 likes | 121 Views
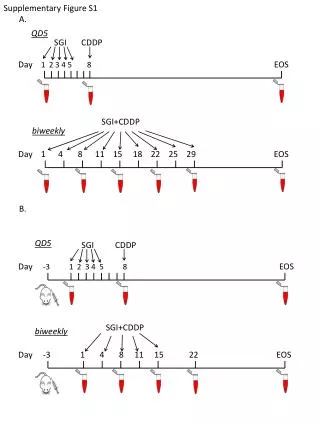
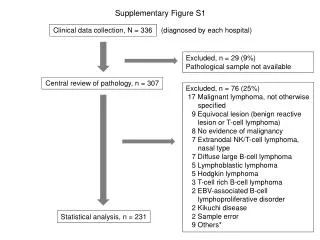
Study on 336 diagnosed patients, excluding 29, reviewing 307 samples, focusing on lymphoma types post-transplant. Statistical analysis on 231 cases for different treatments and outcomes over years after transplant.

E N D
Supplementary Figure S1 Clinical data collection, N = 336 (diagnosed by each hospital) Excluded, n = 29 (9%) Pathological sample not available Central review of pathology, n = 307 Excluded, n = 76 (25%) 17 Malignant lymphoma, not otherwise specified 9 Equivocal lesion (benign reactive lesion or T-cell lymphoma) 8 No evidence of malignancy 7 Extranodal NK/T-cell lymphoma, nasal type 7 Diffuse large B-cell lymphoma 5 Lymphoblastic lymphoma 5 Hodgkin lymphoma 3 T-cell rich B-cell lymphoma 2 EBV-associated B-cell lymphoproliferative disorder 2 Kikuchi disease 2 Sample error 9 Others* Statistical analysis, n = 231
1.00 1.00 P = .24 Auto-SCT Allo-SCT P = .35 0.75 0.75 AITL (n = 20) AITL (n = 47) 0.50 0.50 ALCL (n = 20) PTCL-NOS (n = 48) 0.25 0.25 ALCL (n = 8) PTCL-NOS (n = 55) 0.00 0.00 0 2 0 4 2 6 4 8 6 10 8 10 Years after transplant Years after transplant P = 0.24 Supplementary Figure S2a Supplementary Figure S2b
1.00 0.75 0.50 0.25 0.00 0 2 4 6 8 10 Years after transplant 1.00 P = .85 P = .98 0.75 Reduced-intensity (n = 62) Prior autograft – (n = 71) 0.50 Myeloablative (n = 34) 0.25 Prior autograft + (n = 25) 0.00 0 2 4 6 8 10 Years after transplant P = 0.98 Supplementary Figure S2c Supplementary Figure S2d