Download
1 / 5
50 likes | 112 Views
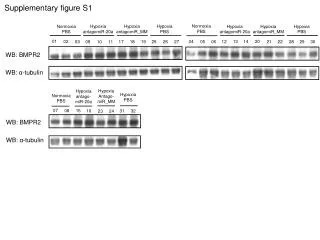
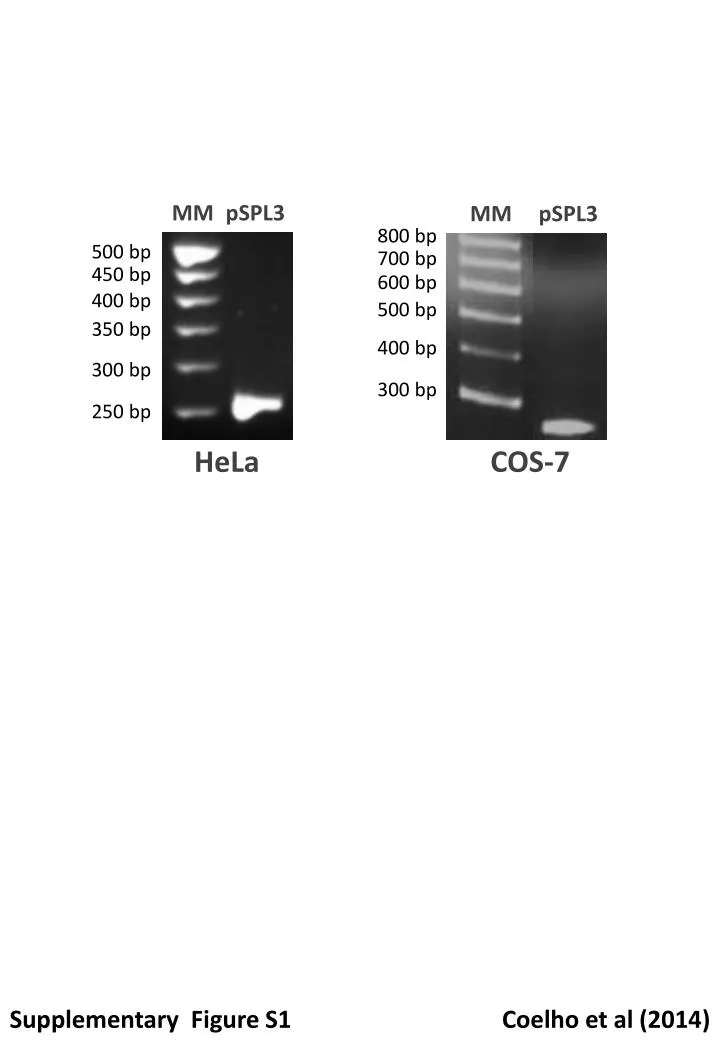
MM. pSPL3. MM. pSPL3. 800 bp. 500 bp. 700 bp. 450 bp. 600 bp. 400 bp. 500 bp. 350 bp. 400 bp. 300 bp. 300 bp. 250 bp. HeLa. COS-7. Supplementary Figure S1. Coelho et al (2014). exon 9. exon 9. gt cagtctc cca g gt aggatcctggggc. exon 8. 3’- gt c ca tcctaggacc - 5’. LNA1.

E N D
MM pSPL3 MM pSPL3 800 bp 500 bp 700 bp 450 bp 600 bp 400 bp 500 bp 350 bp 400 bp 300 bp 300 bp 250 bp HeLa COS-7 Supplementary Figure S1 Coelho et al (2014)
exon 9 exon 9 gtcagtctcccaggtaggatcctggggc exon 8 3’- gtccatcctaggacc - 5’ LNA1 10 nt gtcagtctcccaggtaggatcctggggc exon 8 3’- agagggtccatcctag - 5’ LNA2 5 nt Supplementary Figure S2 Coelho et al (2014)
-LNA +LNA1(0.5 μM) MM 400 bp 300 bp Supplementary Figure S3 Coelho et al (2014)
A p.D274Gfs*17 WT ~45 kDa ~35 kDa B C Supplementary Figure S4 Coelho et al (2014)
A Denatured protein (normalized) [θ] (mdeg.cm-2.dmol-1) a b a b B T (°C) λ (nm) T (°C) C b b a Aggregated protein (normalized) Aggregated protein (normalized) a D T (°C) Time (min) Supplementary Figure S5 Coelho et al (2014)