Millward Brown 2006 Methodology
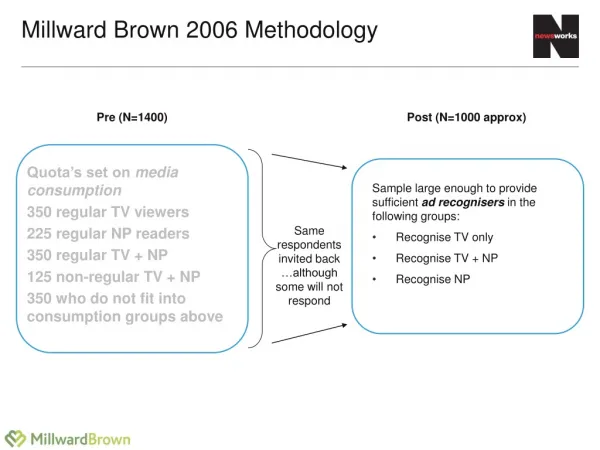
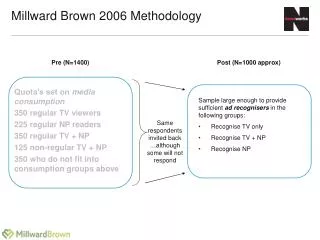
Millward Brown 2006 Methodology. Quota’s set on media consumption 350 regular TV viewers 225 regular NP readers 350 regular TV + NP 125 non-regular TV + NP 350 who do not fit into consumption groups above. Pre (N=1400). Post (N=1000 approx). Sample large enough to provide

Millward Brown 2006 Methodology
E N D
Presentation Transcript
Millward Brown 2006 Methodology Quota’s set on media consumption 350 regular TV viewers 225 regular NP readers 350 regular TV + NP 125 non-regular TV + NP 350 who do not fit into consumption groups above Pre (N=1400) Post (N=1000 approx) Sample large enough to provide sufficient ad recognisers in the following groups: • Recognise TV only • Recognise TV + NP • Recognise NP Same respondents invited back …although some will not respond
Why do we need to speak to the same respondents in the post dip? The effect of any pre-existing brand biases was removed by interviewing the same people both pre and post the marketing activity. People who already feel more positive about a brand, or use it more, may be more likely to notice the brand’s advertising, and so recognise it on a survey (resulting in the‘Rosser-Reeves’ fallacy) We identified the different recognition cells only at post stage. We then tracked these people’s answers back to the pre-stage to see how much answers shifted. Media effects were measured by comparing the pre-post shifts on key brand health metrics among Ad Recognisers of each group: Recognise TV only, Recognise TV+NP, Recognise Any NP Even if people recognising both TV + Newspaper advertising were more favourable to the brand before they saw the ads, they still showed the greatest shifts in attitudes and behaviour after they saw the ads.
The Brand Dynamics pyramid Millward Brown’s Brand Dynamics pyramid shows how many consumers have a relationship with the brand at five key stages. From simple awareness (Presence) through personal Relevance and good enough Performance, to the proportion recognising a clear competitive Advantage and finally those who are closely Bonded with the brand Millward Brown’s validated approach to understanding brand equity
The Brand Dynamics pyramid It has been validated against change in market share and shows that people who reach the bonding stage account for the highest expenditure on the brand Equity and voltage were measured pre-campaign (see Kraft Philadelphia example below). Changes in brand equity post-campaign were analysed according to media exposure High Philadelphia Pre-Wave Olympic Philadelphia Classic Specialist Potential to grow(Voltage™) Little Tiger Competitor Competitor Defender Competitor Competitor Competitor Fading Star Weak Competitor Clean Slate Low Low 0Presence% relative to category average High
Some Key Metrics* Brand Commitment “How likely would you be to choose BRAND the next time you choose?” Top 2 Box: “The only make/one of only two or three” Brand Involvement “How would you feel about BRAND if it came to life as a person” Top 2 Box: “Someone I’d really like/like quite a lot and have lots/some things in common with” Depth of Information “The advertising gives me enough information to decide whether BRAND is for me” Re-appraisal “The advertising is surprising and gets me to think differently about BRAND” Brand Values “The advertising really helps me to connect with BRAND and identify with it more closely” Call to Action “The advertising gives me a reason to go out and but BRAND” *Metrics developed by Hall & Partners