Download
1 / 20
210 likes | 620 Views
IAB Research Case Study on Digital Video Advertising Effectiveness Conducted by Millward Brown and Dynamic Logic December 2008. Background & Objectives.

E N D
IAB Research Case Study on Digital Video Advertising EffectivenessConducted by Millward Brown and Dynamic LogicDecember 2008
Background & Objectives Digital video advertising is one of the fastest growing segments of interactive advertising according to the October 2008 IAB Internet Advertising Revenue Report. However, marketers are still learning how to use the medium most effectively. The IAB prepared a case study to examine what combinations of lengths and placements of digital video advertising are most effective. The IAB commissioned Millward Brown and Dynamic Logic to undertake this groundbreaking research. This project examined a holiday campaign from a major national retailer, and serves as a case study on digital video ad effectiveness. The IAB hopes this case study inspires more research to foster best practices in the area of digital video creative and placement.
Key Sponsor • ESPN.com Research Sponsors Lead Sponsors • Microsoft Advertising • MTV Networks • Tremor Media • Vibrant Supporters • Agency.com • Doubleclick • Forbes.com • NBC • ValueClick
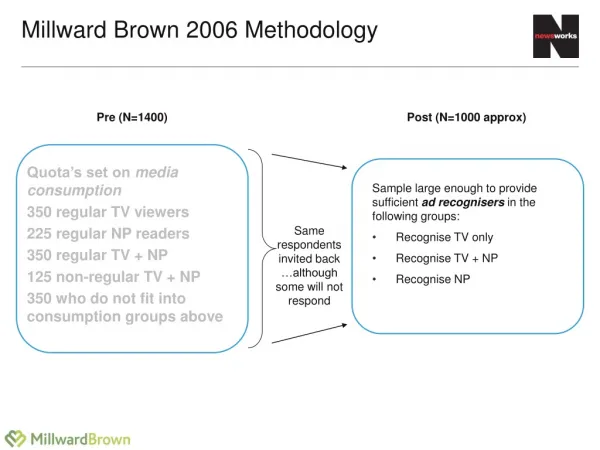
Research Methodology Millward Brown and Dynamic Logic utilized a phased approach in order to provide insights into how ad length and placement influenced the effectiveness of digital video advertising. The first phase was a communications check, specifically Millward Brown's Link™ for Digital Video advertising. Link for Digital Video is used to ensure that ad executions meet minimum communication standards on Engagement, Brand Association and Motivation as well as perform well against desired objectives set by the advertiser. The second phase was an in-market evaluation using Dynamic Logic's AdIndex®. AdIndex uses a "point in time" methodology in which ad exposure is tracked, along with recency and frequency. A short, online survey and a control/exposed methodology is used to quantify the difference in attitudes between those users exposed to the video ads and those who were not (control group). Both groups are sampled simultaneously from the same Web sites; therefore, the only difference between the groups is the presence of the advertising and any attitudinal differences can be attributed to ad exposure. 4
The Overall Approach The 3 ad lengths are executions of the same creative idea.
Overall Learning Let's distinguish between copy test and in market • Results suggest that quality video ad creative is able to increase awareness metrics across all placements and lengths, but when the campaign goal is to persuade consumers to take action or change brand perception, the :15 length and user initiated placements can be more effective. • The :30 length is better than shorter lengths at conveying a complex or emotionally resonant message, but works best in user-initiated placements, where online viewers display more patience for longer messages.
Key Findings by Ad Length 30 Seconds Highest likelihood of being shared online(1) Most persuasive of the three lengths(2) Allows communication of emotional benefits and more complex messages Works well in user initiated placements 5 Seconds Weakest level of breakthrough Most difficult to understand(3) • 15 Seconds • Highest brand association(1) • Easiest to understand(1) • Most efficient (cost vs. creative results) with highest level of engagement(2) • Great for simple, rational messages; challenged for striking an emotional chord. • Optimum length (in this case) for pre-roll • May work for very simple communication strategies • Potentially most suitable for sequencing • A cost effective way to communicate simple messages online • Best suited of the 3 lengths at pre-roll, works in other placements too • Strongly suited to user-initiated placements • Pre-roll success requires a very high level of creative quality (1)Above all other lengths and significantly above norm. (2)Above all other lengths and norm. (3)Significantly above all other lengths and significantly above norm. (4)Above all other lengths but below norm.
Creative Performance While both the :15 and :30 performed well in terms of engaging their audience on conveying key messages, compared to the longer units, the 5 second spot struggles to break through and be "understood." Digital Video Advertising Significantly above MB norms On a par with MB norms Significantly below MB norms :05 :15 :30 Engagement Brand Association Persuasion See Appendix for additional detail Engagement: Advertising awareness index, a measure of Branding, Enjoyment and Involvement. Brand Association: Association of advertising with main points of communication Persuasion:a measure of Relevance, New Information, Believability and Brand Appeal.
Placement Key Findings • Across all three placements, the retailer’s advertising was memorable. • Pre-roll performed well at upper funnel attributes such as unaided brand awareness and online ad awareness. • In-banner and in-text placements were clearly more successful at positively impacting lower funnel image and persuasion measures.
Placement Key Data Ad Performance by Placement (All Lengths) Indexed relative to control group performance. c=control; e=exposed. *Underlying data showed a statistically significant difference at a 90% confidence level
Pre-Roll Lengths: Key Findings • In the pre-roll placement, the 15-second unit performed optimally not only managing to increase awareness measures over control but also impacting positive brand associations. • While the 30-second creative performed well, in a pre-roll placement it actually deterred viewers from shopping and distanced them from the key communication. In other words, good creative was hurt by bad placement.
Pre-Roll Lengths: Key Data Pre-roll Lengths (Mutually Exclusive): Brand Metrics & Attributes Indexed relative to control group performance.A = Unique Control. A/B/C/D = Underlying data showed a statistically significant difference at a 90% confidence level
In-Banner Lengths: Key Findings • Despite their creative potential and spots that played automatically for the :05 and :15, the retailer’s ads went relatively unnoticed in the "in-banner" placement. • Unlike the shorter ad units, the in-banner :30 placement was user initiated. Improvements in intent and brand perceptions for the :30 in-banner placement were quite positive, but this may be due to a pre-existing disposition to the brand in those consumers who chose to view the ad. • Thus care is needed in comparing results from auto-play and user-initiated video creative. 13
Like the in-text placements, the :30 in-banner video was user initiated In-Banner Lengths: Key Data In-Banner Lengths (Mutually Exclusive): Brand Metrics & Attributes Indexed relative to control group performance.A = Unique Control. A/B/C = Underlying data showed a statistically significant difference at a 90% confidence level. ** = Caution, sample size is low.
In-Text Lengths: Key Findings • Exposure to user-initiated in-text videos of all three durations led to higher levels of online ad awareness as well as an increase in intent to visit the store. • As with the in-banner test, in general user-initiated video is more likely to be started and viewed by those already favorably inclined to a brand or message. The relevance of the keywords featured in the in-text placement further serves to enhance shopping intent by reaching a more tightly targeted audience.
In-Text Lengths: Key Data In-Text Lengths (Mutually Exclusive): Brand Metrics & Attributes Indexed relative to control group performance.A = Unique Control. A/B = Underlying data showed a statistically significant difference at a 90% confidence level
Appendix Additional Data on Engagement, Brand Association, and Persuasion
The 5-second spot performed well below the longer units in its ability to breakthrough and be linked to the store. Creative Performance: Engagement The Millward Brown Awareness Index (AI) is a measure of branded engagement which combines measures of Branding, Enjoyment & Involvement. 30.3% 0 :15 ad AI = 7 0:30 ad AI = 6 Norm: 6 35.9% 0 :05 ad AI = 3 33.8% Base: 1,334 USA - Online Finished Film Distribution of Awareness Index scores from the Millward Brown database.
:30C% :05A% :15B% < :13X% :15Y% :30Z% A A AB NA NA NA NA NA NA NA NA NA A A BC Total Respondents: (140) (140) (140) *Finished Film USA Online MB Norms. Creative Performance: Brand Association • All three ads communicated the retailer’s advertising two key attributes • 0:05-sec ad may have left some without a strongly formed impression about the store • Longer versions generated higher positive perceptions of the store Video Ads MB Norms* Q37. Which one of these impressions did the ad give you most strongly about the store? Q38. Which other impressions did the ad give you about the store? A/B/C A/X B/Y C/Z: Significantly higher at the 90% confidence level
The ads generated an average degree of persuasiveness. Creative Performance: Persuasion The Millward Brown Persuasion Score (PS) is a combined rating of Relevance, New Information, Believability and Brand Appeal. Millward Brown Norm: 15 0 40+ 0:30 Creative Persuasion Score: 16 0:05 Creative Persuasion Score: 12 0:15 Creative Persuasion Score: 14 Base: 824 USA - English Online Finished Film Distribution of Persuasion Ratings from the Millward Brown Database. Percentages are shown for every 4.99 score, eg.: 0-4.99:4%, 5-9.99:16%, 10-14.99:30%, 15-29.99:22%, and so on. Persuasion is a measure of Relevance, New Information, Believability and Brand Appeal.


![Research Study Conducted Spring 2012 [ research conducted at six MCCVLC colleges ]](https://cdn1.slideserve.com/1659807/research-study-conducted-spring-2012-research-conducted-at-six-mccvlc-colleges-dt.jpg)