Download
1 / 20
210 likes | 436 Views
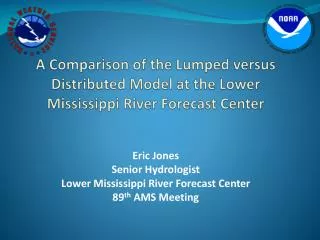
A Comparison of the Lumped versus Distributed Model at the Lower Mississippi River Forecast Center. Eric Jones Senior Hydrologist Lower Mississippi River Forecast Center 89 th AMS Meeting. LMRFC Distributed Model Background. July 2007 - Began development and implementation

E N D
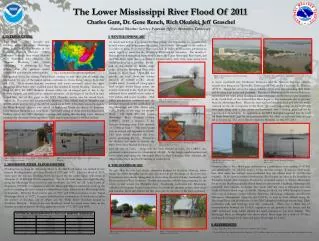
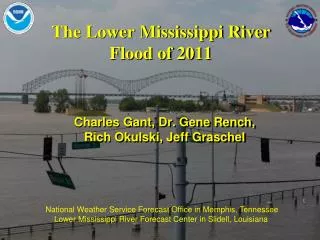
A Comparison of the Lumped versus Distributed Model at the Lower Mississippi River Forecast Center Eric Jones Senior Hydrologist Lower Mississippi River Forecast Center 89th AMS Meeting
LMRFC Distributed Model Background July 2007 - Began development and implementation Used NWS OHD Research Distributed Hydrologic Model V2.0. SACSMA used for rainfall-runoff No snow model used Rating curve method of routing Initially used basins 3, expanded to 7 Calibrated before implemented Verification done on initial three basins Black Creek at Brooklyn, MS (BKN) Leaf River at Collins, MS (CLS) Emory River at Oakdale, TN (OAK)
Basins used in verification OAK CLS BKN
Calibration Statistics(1999-2006 precipitation data, 1hr distributed vs 6hr lumped) Daily RMSE Corr Coef % bias Model Basin (CMSD) ++= Distrib 0.25 46.38 0.724 CLS Lumped -14.10 41.84 0.748 Distrib 9.41 18.94 0.810 BKN Lumped 14.97 15.29 0.791 Distrib -1.28 44.06 0.889 OAK Lumped -15.88 41.74 0.895
LMRFC Operational Verification Timeframe January 2008- October 2008 Simulated Lumped vs Distributed models Not adjusted to stage observations No runtime modifications included in lumped model Statistics on forecasts +24 hours Used quality controlled multi-sensor precipitation est. Mean average PE used for distributed model Mostly computed PE used for lumped model
Realtime Verification Statistics Distrib Lumped Distrib Lumped Distrib Lumped OAK BKN CLS
Realtime Verification Statistics Distrib Lumped Distrib Lumped Distrib Lumped OAK BKN CLS
Realtime Verification Statistics Dist Lump Dist Lump Dist Lump OAK BKN CLS
Analysis of EventsBKN Distrib Obs Lumped One square = 4 km2
Analysis of EventsBKN Obs Distrib Lumped One square = 4 km2
Analysis of EventsBKN Distrib Lumped Obs One square = 4 km2
Analysis of EventsBKN Distrib Lumped Obs
Analysis of EventsCLS Lumped Obs Distrib One square = 4 km2
Analysis of EventsCLS Lumped Distrib Obs One square = 4 km2
Analysis of EventsCLS Obs Lumped Distrib One square = 4 km2
Analysis of EventsCLS Lumped Distrib Obs
Analysis of EventsOAK Lumped Obs Distrib
Analysis of EventsPLA Obs Distrib Lumped
Analysis of EventsWTT Observed Forecast Flood stage Adjusted routing Observed Forecast Unadjusted routing Flood stage
Conclusions Distributed model vs lumped model Distributed model does better in some cases Shape of distributed hydrograph appears to be better Suggestions for hydrologic forecasters Should base forecasts using data from both models