Ch. 28 Chi-square test
Ch. 28 Chi-square test. Used when the data are frequencies (counts) or proportions for 2 or more groups. Example 1. 5. Calculate ((observed-expected)^2) expected 6. Calculate Chi-square = sum of the values from step 5. The degrees of freedom =


Ch. 28 Chi-square test
E N D
Presentation Transcript
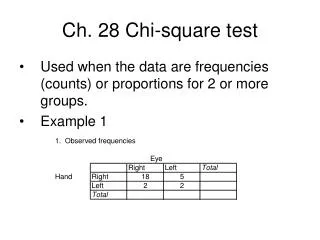
Ch. 28 Chi-square test • Used when the data are frequencies (counts) or proportions for 2 or more groups. • Example 1
5. Calculate ((observed-expected)^2) expected 6. Calculate Chi-square = sum of the values from step 5. The degrees of freedom = (# rows - 1)x(# columns – 1). Find the p-value using the Chi-square table. Activity: Titanic survival data
Null hypothesis: Class and survival are independent. In other words, everyone had the same chance of survival. Use the bootstrap method to estimate the proportions in the box based on the observed data. Null hypothesis: The proportion of “yes” in every class is the same as the overall proportion = 38%.
Chi-square = • P-value =