Download
1 / 32
320 likes | 422 Views
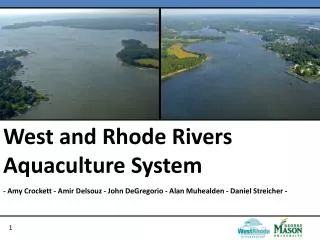
Development and Implementation of a Sustainable GIS at the West/Rhode Riverkeeper Organization. Timothy Love Penn State University & West / Rhode Riverkeeper Chris Trumbauer West / Rhode Riverkeeper Charles Andy Cole Penn State University Department of Landscape Architecture.

E N D
Development and Implementation of a Sustainable GIS at theWest/Rhode Riverkeeper Organization Timothy Love Penn State University & West / Rhode Riverkeeper Chris Trumbauer West / Rhode Riverkeeper Charles Andy Cole Penn State University Department of Landscape Architecture
ProjectMotivation • September 23, 2008: 40,000 Fish Killed in a creek within the West/Rhode Watershed of the Chesapeake Bay in Maryland NOT A RARE OCCURRENCE.
ProjectMotivation Chesapeake Bay Water Quality: 2008 Courtesy CBF Courtesy CBF
ProjectObjectives • Develop and implement a core, sustainable GIS within the West/Rhode Riverkeeper Organization (WRR) of the Waterkeeper Alliance. • Enhance the value of WRR’s water quality analyses using tools designed for non-GIS experts. • Promote adoptable geospatial techniquesfor similar watershed organizations. • Focus on a core set of parameters to be used by WRR to provide value-added Report Card type analyses. • Create sharable spatial information for public and non-profit organizations as well as other scientific agencies
West & Rhode Riversof The Chesapeake Bay Rhode Baltimore Washington West
The West / RhodeRiverkeeper • WRR Mission • Protect families and communities by stopping pollution • Strive for healthy and safe rivers and streams • Work together with communities to enforce environmental law, promote restoration, and advocate for better environmental policy. • Monitor water quality data and provide analyses • Staff • 1 FTE • 3 PTE • 10’s of Volunteers Courtesy Kent Roberts
WR Water QualityMonitoring Locations • Map shows routine observation sites from all organizations within the WR Watershed • Includes tidal and non-tidal stations • This information is shared between all partners
WRR Water QualityMonitoring • Volunteer-based water sampling • Observations physically measured by hand-held instrumentation • 30 active monitoring sites • Most sites accessible from water only; some by land • Station realignment part of project objective
Courtesy YSI WRR Water QualityMonitoring • Standardization of observations is critical • Considerations: • Instrument calibration • Volunteer training • Sampling location • Repeatability
Historical WRRWater Quality Products • Lack of spatial maps for analyses • Difficult to read tabular data • Text data difficult to use for other purposes • Point data insufficient for entire audience: Not Spatially Continuous • Minimal experience with GIS software & techniques
GIS ActivitiesConducted Within this Project • Planning of all aspects • Inventory of data and data users • Database creation and maintenance • Scripting & Automation for all routine processes • Interpolation of vector water quality parameters • Cartography & symbology implementations • Documentation and Metadata creation • Training of WRR staff and partner organizations
ProjectPlanning • Roughly 25% of project timeline devoted to planning • ~3 months • ~275 hours • Used an iterative approach • Engaged in frequent • consultations with stakeholders • Assumed volunteer-based resource availability • Investigated existing capabilities & information • Designed an approach to satisfy multiple customers
Analysis & ProcurementSoftware / Hardware • Considerations were mutually dependent • Factors considered: • Cost, initial and ongoing; Funding options • Functionality • Availability of support: technical & troubleshooting • Compatibility with existing infrastructure • Existing user knowledge • Determination: • ArcGIS Desktop; Windows Laptop PC
DataInventory • Sources: • WRR • Smithsonian Environmental Research Center • George Mason University (GMU) • Chesapeake Bay Program • MD Department of Natural Resources • Parameters • Dissolved oxygen, Water clarity, Bacteria, Salinity, Water temperature, pH • Near-real time & historical records • Data formats
Data UserInventory • All current and prospective users of WR water quality data: • Government decision makers • WRR • Partner Riverkeepers • SERC, DNR, USGS, NOAA • Volunteers • Researchers • The Public: Residents, Boaters, Fishermen, Swimmers, Beachgoers
VBArcObjectsScripting • Approx 1350 lines of optimized code • Download & import raw WQ data • Add to map & join to master file • Perform quality control • Define projection and system • Perform IDW interpolation • Integrate with Geodatabase • Apply symbologies • Create static graphics for web • Populate ArcMap templates
GeodatabaseConsiderations • Goal: Focus on storage of the core set of parameters and incorporate critical pre-existing spatial base layers • Based on user requirements, uses Personal Geodatabase • Fields, attributes defined to minimize disk space • Geodatabase placed on laptop PC and archived via external hard drive • Geodatabase works seamlessly with other project subtasks (data conversion, interpolations, archival)
InterpolationAutomation • Goals • Determine the most appropriate methodologies for estimations of core parameters • Develop a tool to allow WRR users to quickly create interpolations • Provide input to location of monitoring stations • Determinations • IDW using a constant 3 input points provides a continuously accurate interpolation • A single method did indeed produce reasonable results for all parameters • Usage of barrier lines was problematic
Operational SoftwareTemplate • A set of templates used by WRR staff for their primary GIS activities/analyses • User friendly, easy to learn • Solid and concise, rather than elaborate and unmanageable • Thoughtful symbological definitions for all layers • Tools created within this project reside here • Linked to Geodatabase
Courtesy GMU Courtesy GMU Courtesy YSI GMU TeamInteraction • George Mason University Systems Engineering group developed a plan to increase usability of water quality monitoring program. Their goals: • Increased accuracy of parameter measurements • Reduced data transmission latency • Optimal placement of monitoring station locations • My goal was to ensure that their project effectively incorporated GIS aspects of WRR • Ensured that this project incorporated their results
GMU TeamInteraction Old Site Locations Proposed Locations Critical New Locations Many Redundancies Missing Regions
Inputs to 2008 WRRReport Card • Report Card summarizes the state of water quality in the WR Watershed Rivers • To provide value-added spatial analyses and graphical products • A primary deliverable of this project • WQ products yielded the basic format for the automated graphic tool
Documentation • Goal: Provide sufficient documentation for WRR personnel to understand, run, and maintain all project deliverables • Introduce / familiarize basic GIS concepts to WRR & Riverkeepers • Provide relevant Metadata for each spatial field • FGDC Content Standard for Digital Geospatial Metadata (CSDGM), Vers. 2 • Produced documentation in multiple formats: • PowerPoint; Digital Documents; XML; Hardcopy; Oral Presentations
Training • Goals include sustainability and collaboration • Based on accompanying documentation • Focused on hands-on spatial applications and GIS basic theory • Primarily 1-on-1 and small group sessions • Target audience is WRR organization, partner Riverkeepers, and other Bay organizations • To be held September 2009 for 10 Riverkeeper and partner organizations
Fish Kill:Algae Bloom • Algae bloom appears on surface due to excessive nutrients in water, then falls to bottom of river • Algae begins decomposing and consumes oxygen in process • O2 approaches minimum threshold for fish survival • Nighttime processes further reduce O2 levels • Fish cannot survive
Fish KillRevisited • Imagery clearly depicted reduced dissolved oxygen levels in area of fish kill
Links • W/R Riverkeeper: • http://www.westrhoderiverkeeper.org/ • Penn State Geography Department: • http://www.geog.psu.edu/ • George Mason University Systems Engineering: • http://www.seor.gmu.edu/ • Chesapeake Bay Foundation: • http://www.cbf.org/ • Waterkeeper Alliance: • http://www.waterkeeper.org
Thanks! • West / Rhode Riverkeeper • Penn State Dept. of Landscape Architecture • Penn State Dept. of Geography • George Mason University • DNR, SERC, USGS, NOAA