Mastering Spreadsheet Functions for Simulation and Visualization
Learn how to utilize spreadsheet programs for calculations, visualization, and simulation on computers effectively. Understand the benefits and pitfalls of using spreadsheet graphics as communication tools, alongside exploring other software tools for numeric processing across different computing devices.

Mastering Spreadsheet Functions for Simulation and Visualization
E N D
Presentation Transcript
6 Calculations, Visualization, and Simulation
Learning Objectives • Describe the basic functions and applications of spreadsheet programs on personal computers • Show how spreadsheet graphics can be used and misused as communication tools. • Describe other software tools for processing numbers and symbols on personal computers, workstations, and mainframes. 2001 Prentice Hall
Learning Objectives • Explain how computers are used as tools for simulating mechanical, biological, and social systems. • Discuss the advantages and disadvantages of computer simulation as a tool for research and education. 2001 Prentice Hall
Chapter Outline “The purpose of computation is not numbers but insight.” R. W. Hamming.. • The Spreadsheet: Software for Simulation and Speculation • Statistical Software: Beyond Spreadsheets • Statistics and Data Analysis • Scientific Visualization • Calculated Risks: Computer Modeling and Simulation 2001 Prentice Hall
The Spreadsheet The spreadsheet is malleable matrix that consists of: • Columns(alphabetical horizontal divisions) • Rows(numbered vertical divisions) • Worksheet(a spreadsheet document) 2001 Prentice Hall
Cell C12 The Spreadsheet The spreadsheet consists of: • Addresses (column letter and row number, e.g., A1, C12) • Cells (the intersection of a row Cell A1 • and column) 2001 Prentice Hall
The Spreadsheet The Worksheet is a grid formed by columns and rows and can contain : Values such as numbers and dates • Labels that explain what a value means, such as column and report headings 2001 Prentice Hall
The Spreadsheet Formulas allow you to create instructions using mathematical expressions and commands • + (plus) • - (minus) • * (multiplication) • / (division) • Sum • Average 2001 Prentice Hall
Type the first value in the series such as Qtr 1 or January or 500 Spreadsheet Features Spreadsheets offer many automatic features such as replication of data and let the software replicate it to other cells. 2001 Prentice Hall
Spreadsheet Features • Formulas can be relative, so they refer to different cells when they are copied • Or absolute, so the formula references never change when they are copied When the formula in column B is copied to column C, it changes relative to the new column. 2001 Prentice Hall
Spreadsheet Features Automatic recalculation • Any time a change is entered into the spreadsheet, all data related to the change automatically updates. 2001 Prentice Hall
Spreadsheet Features • Functions(e.g., SUM, AVG, SQRT) are used to automate complex calculations • Macros let you store keystrokes and commands so they can be played back automatically • Templates offer ready-to-use worksheets with labels and formulas already entered 2001 Prentice Hall
Spreadsheet Features Linking spreadsheets together • When values change in one spreadsheet, • all linked spreadsheets update automatically 2001 Prentice Hall
Spreadsheet Features • Search for information • Sort the data by a specific criteria • Merge the data with a word processor • Generate reports Database capabilities 2001 Prentice Hall
“What If?” • Spreadsheets allow you to change numbers and instantly see the effects of those changes. • “What if I enter this value?” • Equation solvers • Some spreadsheets generate data needed to fit a given equation and target value. 2001 Prentice Hall
Spreadsheet Graphics: From Digits to Drawings • Charts allow you to turn numbers into visual data: • Pie charts (show relative proportions to the whole) • Line charts (show trends or relationships over time) 2001 Prentice Hall
Spreadsheet Graphics: From Digits to Drawings • Bar charts (use if data falls into a few categories) • Scatter charts (use to discover, rather than to display, a relationship between two variables) 2001 Prentice Hall
Avoiding Spreadsheet Pitfalls • Build in cross checks • Change the input data values and study the results • Take advantage of preprogrammed functions, templates and macros • Use a spreadsheet as a decision-making aid, not a decision maker • Plan the work sheet before you start entering • Make assumptions as accurate as possible • Double-check every formula and value (GIGO) • Make formula readable • Check your output against other system 2001 Prentice Hall
Statistical Software:Beyond Spreadsheets Accounting and FinancialManagement software allows you to do electronically handle routine transactions such as: • writing checks • balancing accounts • creating budgets 2001 Prentice Hall
Statistical Software:Beyond Spreadsheets Mathematics Processing software turns abstract mathematical relationships into visual objects. 2001 Prentice Hall
Statistical Software: Beyond Spreadsheets Statistical and data analysis software collects and analyzes data that tests the strength of data relationships. 2001 Prentice Hall
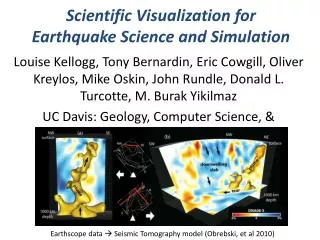
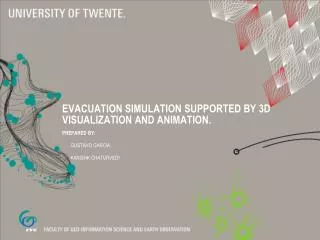
Statistical Software: Beyond Spreadsheets Scientific visualizationsoftware uses shape, location in space, color, brightness, and motion to help us visualize data. 2001 Prentice Hall
Calculated Risks: Computer Modeling and Simulation Computer modeling uses computers to create abstract models of objects, organisms, organizations, and processes 2001 Prentice Hall
Computer Modeling and Simulation Examples: • computer games (chess boards, sports arenas, and mythological societies) • computer models of organisms, objects, and organizations • flight simulators and simulations of science lab activities • managing a business, city, or nation 2001 Prentice Hall
Computer Simulation Computer Simulations are widely used for research in the physical, biological, and social sciences, and in engineering. 2001 Prentice Hall
Computer Modeling and Simulation Schools, businesses, and the military use simulations for training because: • Safety: non-threatening environments • Economy: less expensive than real life • Projection: less threatening to systems • Visualization: allows to see and understand • Replication: allows repetition of projects 2001 Prentice Hall
Computer Simulation:The Risks Risks: • Simulation isn’t reality. • Not all factors can be entered into the model or simulation. 2001 Prentice Hall
Selected Answers to Review Questions (Q) Describe examples of several different types of charts, and explain how they’re typically used (A) Pie charts are used to show how a whole is divided up. Bar charts and line charts can be used to show trends and changes in data usually over time, or to show differences in values of different categories of data. Scatter charts are used to display raw data, displaying each data point individually. 2001 Prentice Hall
Selected Answers to Review Questions (Q) List several advantages and disadvantages of using computer simulations for decision making. (A) Advantages include the ability to test designs prior to actually building them, thereby providing significant safety and economic benefits. Disadvantages include the possibility of modeling errors and the limitations of computer technology to create realistic models 2001 Prentice Hall