Download
1 / 12
120 likes | 230 Views
This paper explores the integration of scientific visualization in earthquake science and simulation, highlighting the KeckCAVES platform and its applications in rapid response to natural hazards. It discusses 3D visualization tools and LIDAR data analysis used to assess damages from the 2010 Haiti earthquake, which resulted in significant casualties and structural collapse. Additionally, the research emphasizes the importance of interactive visualization in virtual reality environments, enabling improved interpretation of large datasets, enhancing situational awareness, and supporting scientific response to seismic events.

E N D
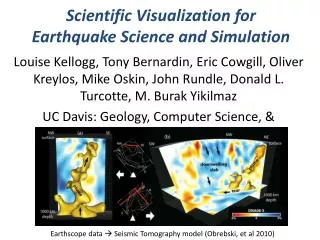
Scientific Visualization for Earthquake Science and Simulation Louise Kellogg, Tony Bernardin, Eric Cowgill, Oliver Kreylos, Mike Oskin, John Rundle, Donald L. Turcotte, M. BurakYikilmaz UC Davis: Geology, Computer Science, & KeckCAVES Earthscope data Seismic Tomography model (Obrebski, et al 2010)
Scientific visualization research for natural hazards at the KeckCAVES CAVES Desktop Laptop 3D TV Lidar Viewer Crusta Earth Viewer 3D Visualizer Virtual Reality User Interface (VRUI) A platform-independent foundation for development of virtual reality applications
Haiti: January 12, 2010Mw 7.0 • 200,000 – 300,000 fatalities. • Massive damage from building collapse including houses, govt. buildings, UN headquarters, airport.
Analysis of high-resolution airborne and terrestrial LIDAR after recent events • January 21 – 27, 2010, an area of 850 km2 surveyed using airborne LiDAR at an average density of ~3.2 points/m2 • Funded by World Bank, coordinated by USGS, collected by Rochester Institute of Technology • Goal: • support rescue and recovery first • and then to support science • ~2.7 billion individual point measurements in (3D) space; 66.8 GB on disk
Remote mapping • Guided field work • Gave consistent results as found in the field • Can improve quality and quantity of rapid scientific response
We concluded that the 2010 earthquake was a relatively smallevent between the 1751 and 1770 ruptures.
El Mayor-Cucapah M 7.2 April 2010 Removing vegetation from LIDAR data Credit: Mike Oskin, RamonArrowsmith, Alejandro Hinojosa, and Javier Gonzalez
Interactive scientific visualization for rapid response • Interactive visualization in a VR environment has the potential to completely change rapid scientific response to events • Visualization of these very large datasets is challenging, but feasible, using octree data representation. • Human-in-the-loop is essential to interpretation (combined with automated methods) • Underway: change detection (time series) • Future developments: Coupling data interpretations with simulations