Glaucoma Simulation & Visualization
Glaucoma Simulation & Visualization. Presenter Farid Harhad . IGERT Associate. Computer Science. Spring 2007 High School Workshop. Overview. Motivation What is Glaucoma? Anatomy of the Eye CFD Simulation of the Disease Eye Simulation Data Visualization of the Simulation

Glaucoma Simulation & Visualization
E N D
Presentation Transcript
Glaucoma Simulation & Visualization Presenter Farid Harhad. IGERT Associate. Computer Science Spring 2007 High School Workshop
Overview • Motivation • What is Glaucoma? • Anatomy of the Eye • CFD Simulation of the Disease • Eye Simulation Data • Visualization of the Simulation • Tutorial Highlights
Motivation • Investigating fundamental mechanisms of flow in the eye helps us understand the leading causes of glaucoma • CFD simulation of glaucoma produces large amounts of data that can only be interpreted and analyzed using visualization
Part 1: Overview of the Disease
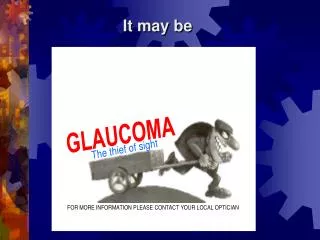
What is Glaucoma? • Glaucoma leads to blindness by damaging the retinal cells[1] • Elevated pressure in the eye is a risk factor, but even people with normal pressure can lose vision[1] • World wide, second leading cause of blindness[1]
Anatomy of the Eye (1/2) [2] • Light enters the eye by passing through • Cornea, • anterior chamber, pupil, • lens, • vitreous body, • retina • Optic nerve carries signal from retina to brain • High fluid pressure damages retinal nerve fibers and optic disc begins to hallow [3]
Anatomy of the Eye (2/2) • Ciliary body consists of ciliary muscle and ciliary processes • Ciliary processes is a vascularized layer which secretes a fluid called the aqueous humor (AH) [2]
Eye Fluid Drainage • AH flows radially inward from ciliary body and drains in the trabecular meshwork and Schlemm’s canals • CFD simulation done for angle-closure glaucoma • In angle-closure glaucoma, the iris deforms and blocks normal flow [5] [5]
Part 2: CFD Simulation of the Disease
CFD Simulation of Angle-Closure Glaucoma • Natural convection due to temperature difference between the ambient air (25 °C / 77 °F) and the interior of the eye (37 °C / 98.6 °F) leads to a buoyancy flow. • Apply the conservation of momentum law (fluid form of Newton’s law) to model the flow in the eye. [2]
CFD Simulation of Glaucoma • Mathematical equations of the physical model are numerically solved w/ computers: • Material particle method (deformable iris) • Immersed boundary (iris+fluid) • Fluid solver (fluid) • Eye geometry information was modeled using ANSYS software and fed into the numerical model
Part 3: Visual Analysis of the Simulation Results
Eye Simulation Data • Two types of datasets used: • irisgeometry: consists of the vertices of the tessellated bottom surface of the iris • flow information: time-dependent velocities (u, v, w), P, & T at 69741 locations in the eye.
Scalars • Scalars • Physical quantities that are completely characterized by one number • Examples: mass of an object, temperature of an object, electrical potential, height … 2844 lbs 100 ºF 1.5 V
Vectors [7] • Vector • Consists of a magnitude and direction • Vectors are often represented graphically by arrows • Examples: velocity of an object, gravity, magnetic field ... • Example: 30 ~ 60 μ Tesla [8] 112 mph [6]
Visualization Techniques • Vector data: velocity distribution • LIC (Line Integral Convolution) basic idea [9]
Visualization Techniques • Scalar data: pressure distribution w/ colormaps • Eg. often a color lookup table, is used to map a range of scalar data to a predefined color
Visualization Process T=0, T=1, … T=1573 Image Sequence (1574 timesteps) render geometry using polygons Eye geometry T=0, T=1, … T=1573 Vector data render using LIC render using a colormap Scalar data Data Visualization Movie Generation CFD Simulation (2) (3) (1)
Recap • Glaucoma is a group of diseases that leads to blindness • Common cause is when the aqueous humor does not drain properly and pressure buildup damages the optic nerve • CFD computer model takes into account the buoyancy flow and conservation of momentum • We visualize the velocity of the flow in the eye using LIC (line integral convolution) • We visualize the pressure distribution in the eye using colormaps
Tutorial Overview • Two parts: • Part 1 (~10 min): familiarize yourself with visualization software • Part 2 (~25 min): load iris + flow data and visualize them
Credits • References: • http://en.wikipedia.org/wiki/Glaucoma • C. Ross et al. Ocular Biomechanics and Biotransport. Annu. Rev. Biomed. Eng. 2004. • Ian Albert. Anatomy of the Eye. http://ian-albert.com/graphics/anatomy.php • Moore, Keith L. Moore. Essential Clinical Anatomy, 2nd Edition. LWW, 2002. 8.6.3 • National Eye Institute. http://www.nei.nih.gov/photo/search/keyword.asp?keyword=glaucoma • http://en.wikipedia.org/wiki/Vector_%28spatial%29 • http://www.calstatela.edu/faculty/acolvil/plates/magnetic_field.jpg • 3D Turbulent flow over a car. http://www.cmis.csiro.au/cfd/fem/car/index.htm
Credits • References (continued): • G. Erlebacher . Texture and Feature based Visualization. http://www-hagen.informatik.uni-kl.de/vis06-tutorial/materials/erlebacherVis06slides.pdf • Simulation Datasets: • Dr. Anvar Gilmanov • Eye Flow Movie: • Farid Harhad