Download

1 / 19
190 likes | 281 Views
Explore the rise of American Republican Capitalism and its impact on the nation from 1830 to 1930, including economic growth, crises, and political shifts. Discover historical data and election information to analyze these trends.

E N D
The Emerging American Empire Republican Capitalist Development in the USA, 1830-1930
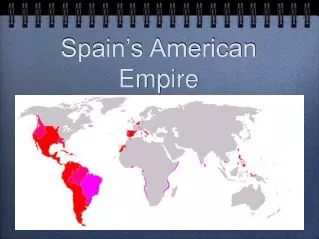
Emerging Empire • Boom and Bust of American Industrial Capitalism: 1830-1930 • Increasing GDP per-capita • Increasing territorial base • Establishing a Bipartisan System • The Triumph of American [sic] Republican Capitalism • The Crisis of 1929-1940
Figure 1U.S. Private Production Per-capita, 1800-1940 Source: U.S. Bureau of the Census, Historical Statistics of the United States, 1789-1945 (D. C., 1949).
Table 1Population, Private Production Value (in millions) and Production Value (in thousands) Per-capita in the U.S., 1800-1930 Source: U.S. Bureau of the Census, Historical Statistics of the United States, 1789-1945 (Washington D. C., 1949).
Figure 2 Source: Minnesota Population Center. National Historical Geographic Information System: Version 2.0. Minneapolis, MN: University of Minnesota 2011. http://www.nhgis.org
Figure 3State Electoral Votes in U.S. Presidential Election of 1796 Source: http://www.presidency.ucsb.edu/showelection.php?year=1796
Figure 4Presidential Election 1800 Source: http://www.presidency.ucsb.edu/showelection.php?year=1800
Figure 5Presidential Election 1824 Source: http://www.presidency.ucsb.edu/showelection.php?year=1800
Figure 6Presidential Election of 1828 source: http://www.historycentral.com/elections/
Figure 7Presidential Election of 1840 source: http://www.historycentral.com/elections/
Figure 8Presidential Election 1848 Source: http://www.presidency.ucsb.edu/showelection.php?year=1848
Figure 9Presidential Election 1860 Source: Minnesota Population Center. National Historical Geographic Information System: Version 2.0. Minneapolis, MN: University of Minnesota 2011. http://www.nhgis.org; election data: ICPSR 0001
Figure 10Presidential Election 1876 source: http://www.historycentral.com/elections/
Figure 11Presidential Election 1896 source: http://www.historycentral.com/elections/
Figure 12Presidential Election 1932 source: http://www.historycentral.com/elections/
Summary and Conclusion • 1830-1930 • Economic growth: especially after 1900 • Economic crises: big one in 1929 • Political crises: party systems rise and fall • Using NGHIS and ICPSR we can analyze these economic and political effects on whatever we wish to explain (e.g., terrorism) • Or we can just look at the pictures (which are interesting)
Figure 11Presidential Election 1896 source: http://www.historycentral.com/elections/
Online Sources for Election Maps • http://www.presidency.ucsb.edu/showelection.php?year=1824 • http://www.historycentral.com/elections/ • Both of these are readily accessible and easy to use, but they do contain some errors. Even the ICPSR data should be used with care • Next year: 1948-2008 or 1892-1912: for another partisan shift