Download
1 / 16
160 likes | 271 Views
The State of Tablet Metrics. Everything We Know is Wrong. So What’s Wrong?. Tablet media will provide unprecedented levels of engagement But major media publishers apply print media metrics. ?. =. So What’s Wrong?. Clickthroughs are dead

E N D
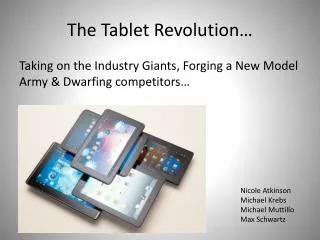
The State of Tablet Metrics Everything We Know is Wrong
So What’s Wrong? • Tablet media will provide unprecedented levels of engagement • But major media publishers apply print media metrics ? =
So What’s Wrong? • Clickthroughs are dead • Fulfillment must be done within app to maximize user experience • Readers per copy is dead Here Lies CTR and RPC
Well What DO we Know? • People are relaxed: 20% of iPad usage occurs in bed* *NPD survey data
Well What DO we Know? • Engagement: more time spent with tablet apps than smartphone apps* *Ipsos/Mendelsohn 2010 Affluent survey
Well What DO we Know? • Early adopter factor brings a young male skew1 • Will likely even out over time • Interest seen by older affluent crowd2 1 Nielsen Connected Devices Report 2Ipsos/Mendelsohn 2010 Affluent survey
Planning Metrics • Largely vendor supplied • Total installs • Time spent • Easy to blame Apple • Publishers hiding behind Apple issues
Planning Metrics • Harder to come by: • Avg. monthly users (audience) • Audience demographics
Pricing • Pricing: Flat fee or CPM • CPMs high • FT app brought in $1.5MM+ in less than 6 months • Flat fee pricing problematic with little post analysis or verification available
Party Like it’s 1999? • 3rd party serving only for basic units • Like early web, benchmarks are lacking
Post Campaign Reporting • Publisher supplied metrics • Impressions • Engagement rates • Rich media actions
What Else Can we Get? • Video metrics applicable for in-app ads • Started • Time spent with each brand experience • % completed
The Quandary • The tablet is more than a new media vehicle • It is a new platform/media environment • In addition to the platform, individual vehicles must be evaluated for their significant differences
Getting the Mindset • Recognize that tablet facilitates/replicates more than one medium, all of which need separate metrics • Print • Video
The Next Steps • Tracking across apps, browsers, platforms • Increased use of location • Front-facing cameras • More advanced web apps - HTML 5 • Improved experience in web visitation and return to app
Basic Wish List • Some immediately applicable areas: • Serving across platforms • Time spent with app/ad • Pages viewed (% and completion) • Engagement + Interactivity • Apply existing video metrics: • Started • Time spent • Completed